- Equities finish the week strong and push higher on Friday.
- The VIX also dipped and dropped 8.29% on the session.
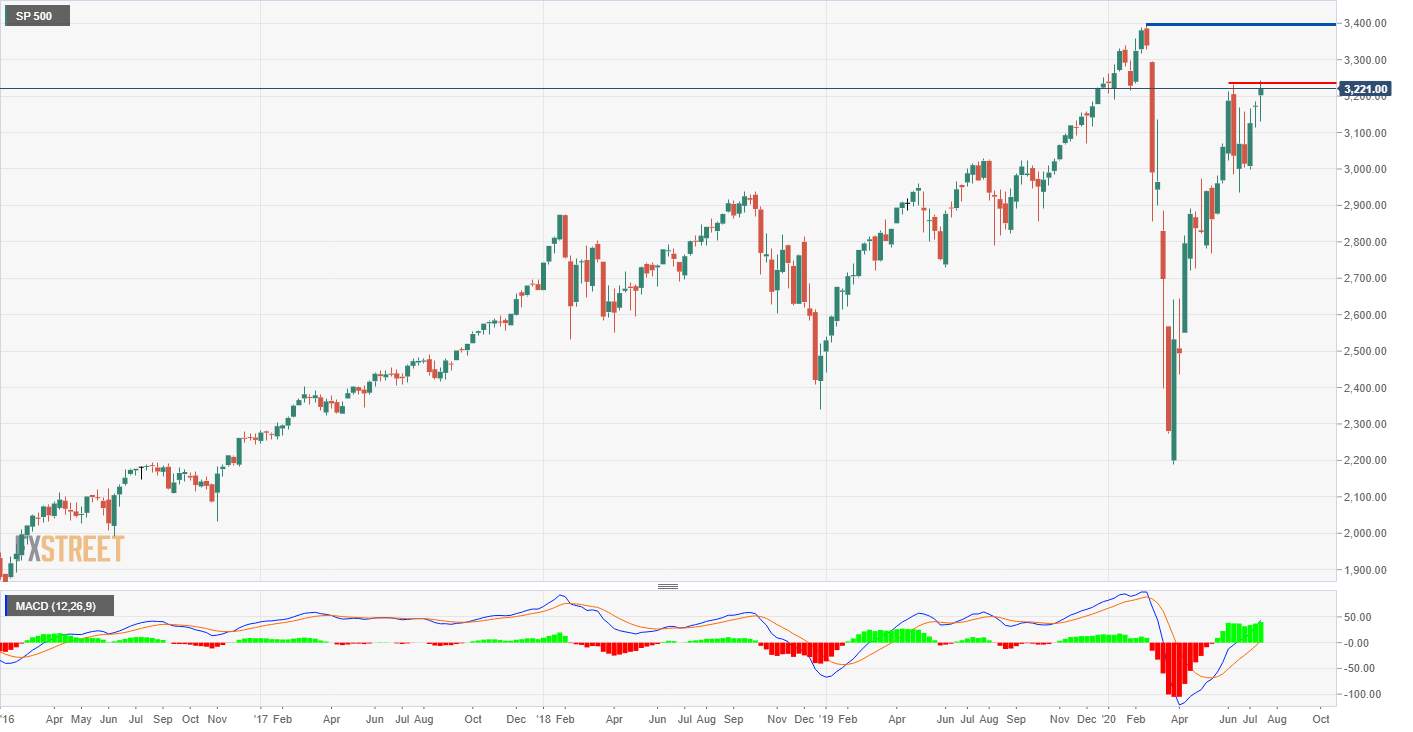
S&P 500 weekly chart
It has been a positive week for stocks as vaccine stories dominate the headlines over the week. The bullishness comes despite the US coronavirus cases hitting record levels. Interestingly the tech sector which is usually so strong wobbled as Apple (NASDAQ:APPL), Netflix (NASDAQ:NFLX), Facebook (NASDAQ:FB) and Google (NASDAQ:GOOG) all end the week lower. Obviously, with all the vaccine talk the Pharma sector was of the outperforming sectors but other defensive sectors such as utilities performed well.
Looking at the chart below, the price took out the previous wave high of 3233.13. This was a bullish sign and now the bulls may go on to target 3393.52 the pre-COVID-19 high. The MACD indicator is in full bullish mode as the histogram bars are green and increasing in size and the signal lines are above the mid-level. Interestingly, the CBOE volatility index (VIX) broke the 200 daily Simple Moving Average to the downside and it could be heading to more "normal" levels below the 23.9 support.
In Europe, the FTSE 100 (3.20%) and DAX (1.95%) both also pushed higher. The move in the DAX also becomes even more impressive as EUR strength was also noted this week. The FTSE may have risen the most out of the major bourses but it is the furthest away from the pre-COVID-19 highs. The FSTE is now around 22% away from the highs and maybe if the bullishness continues it could catch up with the others. There will be news from the Euro Group meeting this weekend and if the EUR 750 bln rescue package is agreed maybe it could be another bullish start to next week.
Additional levels
SP 500
| OVERVIEW | |
|---|---|
| Today last price | 3221 |
| Today Daily Change | 13.00 |
| Today Daily Change % | 0.41 |
| Today daily open | 3208 |
| TRENDS | |
|---|---|
| Daily SMA20 | 3131.28 |
| Daily SMA50 | 3068.46 |
| Daily SMA100 | 2896.64 |
| Daily SMA200 | 3039.11 |
| LEVELS | |
|---|---|
| Previous Daily High | 3215.5 |
| Previous Daily Low | 3199.25 |
| Previous Weekly High | 3184.5 |
| Previous Weekly Low | 3115 |
| Previous Monthly High | 3233.25 |
| Previous Monthly Low | 2936.5 |
| Daily Fibonacci 38.2% | 3205.46 |
| Daily Fibonacci 61.8% | 3209.29 |
| Daily Pivot Point S1 | 3199.67 |
| Daily Pivot Point S2 | 3191.33 |
| Daily Pivot Point S3 | 3183.42 |
| Daily Pivot Point R1 | 3215.92 |
| Daily Pivot Point R2 | 3223.83 |
| Daily Pivot Point R3 | 3232.17 |
Reprinted from FxStreet, the copyright all reserved by the original author.
免責事項:本記事で述べられている見解は著者の見解のみであり、Followmeの公式見解を反映するものではありません。Followmeは、提供された情報の正確性、完全性、信頼性について一切責任を負いません。また、書面で明示的に記載されている場合を除き、本記事の内容に基づいて行われたいかなる行動についても責任を負いません。

古いコメントはありません。ソファをつかむ最初のものになりましょう。