Gold (XAU/USD) managed to break above the previous top at $1,911 – dating back to September 2011. The new all-time high was created surprisingly easily with no real battle from the bears at the resistance area. Is there any direction but up at the moment?
Price Charts and Technical Analysis
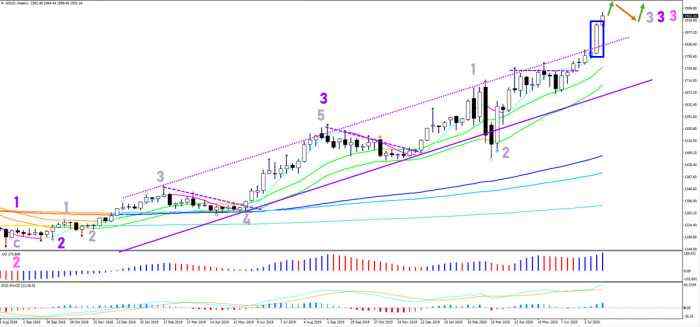
The weekly candlestick from last week closed extremely bullish (close near the high). But the candle was large as well indicating lots of volatility and momentum. It also clearly broke above the channel top and the previous top without any hesitation. The bullish price action seems to confirm the development of various waves 3 on the weekly chart. More upside is therefore likely, although some type of correction (flag or triangle) could place eventually.
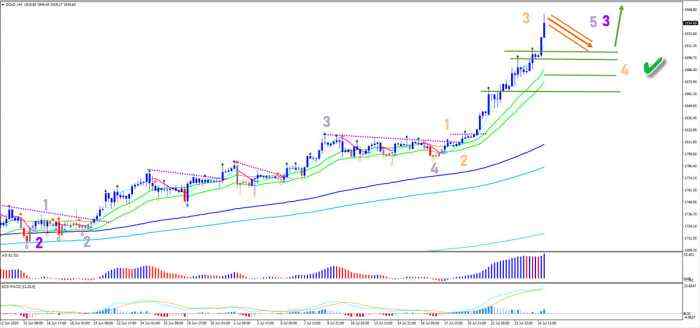
The 4 hour Gold chart shows how much bullish momentum the price swing is showing. The angle of the moving averages (MAs) are very steep and pull away significantly from the long-term MAs. This is typical for a wave 3 (orange) pattern and the momentum could push it higher. But as a trader, it might be better to wave for a wave 4 pattern back to support. A bounce at the support zone (green) is very likely at the moment.
免責事項:本記事で述べられている見解は著者の見解のみであり、Followmeの公式見解を反映するものではありません。Followmeは、提供された情報の正確性、完全性、信頼性について一切責任を負いません。また、書面で明示的に記載されている場合を除き、本記事の内容に基づいて行われたいかなる行動についても責任を負いません。

古いコメントはありません。ソファをつかむ最初のものになりましょう。