GOLD (XAU/USD) AND SILVER (XAG/USD) ANALYSIS, PRICES AND CHARTS
- Gold cruises through $2,000/oz. and continues to set fresh records.
- Silver’s volatility jumps to a five-year high.
The ongoing rally in the US Treasury market is fueling demand for gold, and silver, as US real yields – nominal US Treasury yields less inflation - continue to turn further negative. Five-year real yields are now around -1.26%, while 10-year real yields are quoted around -1.05%, both at or near record-low levels. Negative US real-yields are a positive driver for non-interest bearing gold and also suggest that the US economy remains in a precarious state, leaving the door open for increased fiscal and monetary support, thus weighing further on the value of the US dollar.
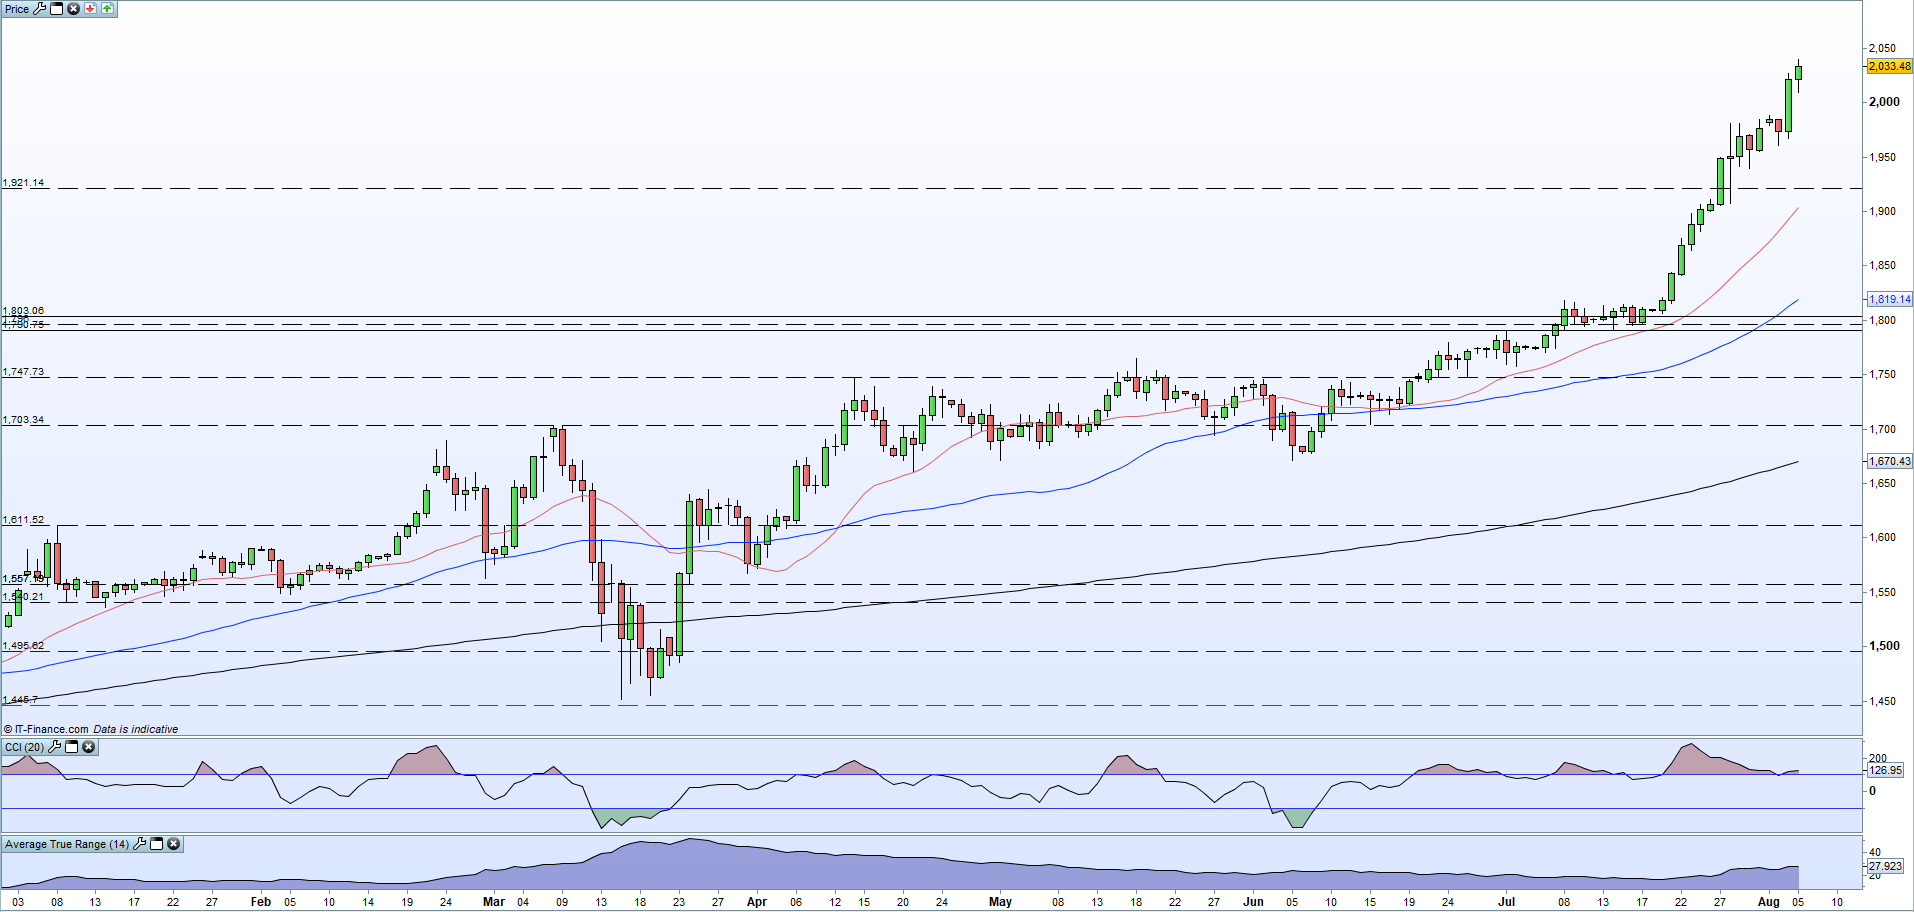
The daily chart shows the sharp rally in gold since a consolidation zone in early-to-mid July around $1,800/oz. to $1,820/oz. Gold has rallied over $200/oz. since then and late Tuesday broke through $2,000/oz. with ease, and, more importantly from a technical point of view, opened above this level today. With gold now at its highest ever level, finding areas of resistance or new bullish targets becomes increasingly difficult and choppy price action may occur in the short-term. Gold remains overbought but nowhere near the extreme levels seen in late-July and volatility (ATR) is at a three-month high. Any pull-backs should be looked at closely.
GOLD (XAU/USD) DAILY PRICE CHART (JANUARY – AUGUST 5, 2020)
SILVER MAKING NEW MULTI-YEAR RECORDS
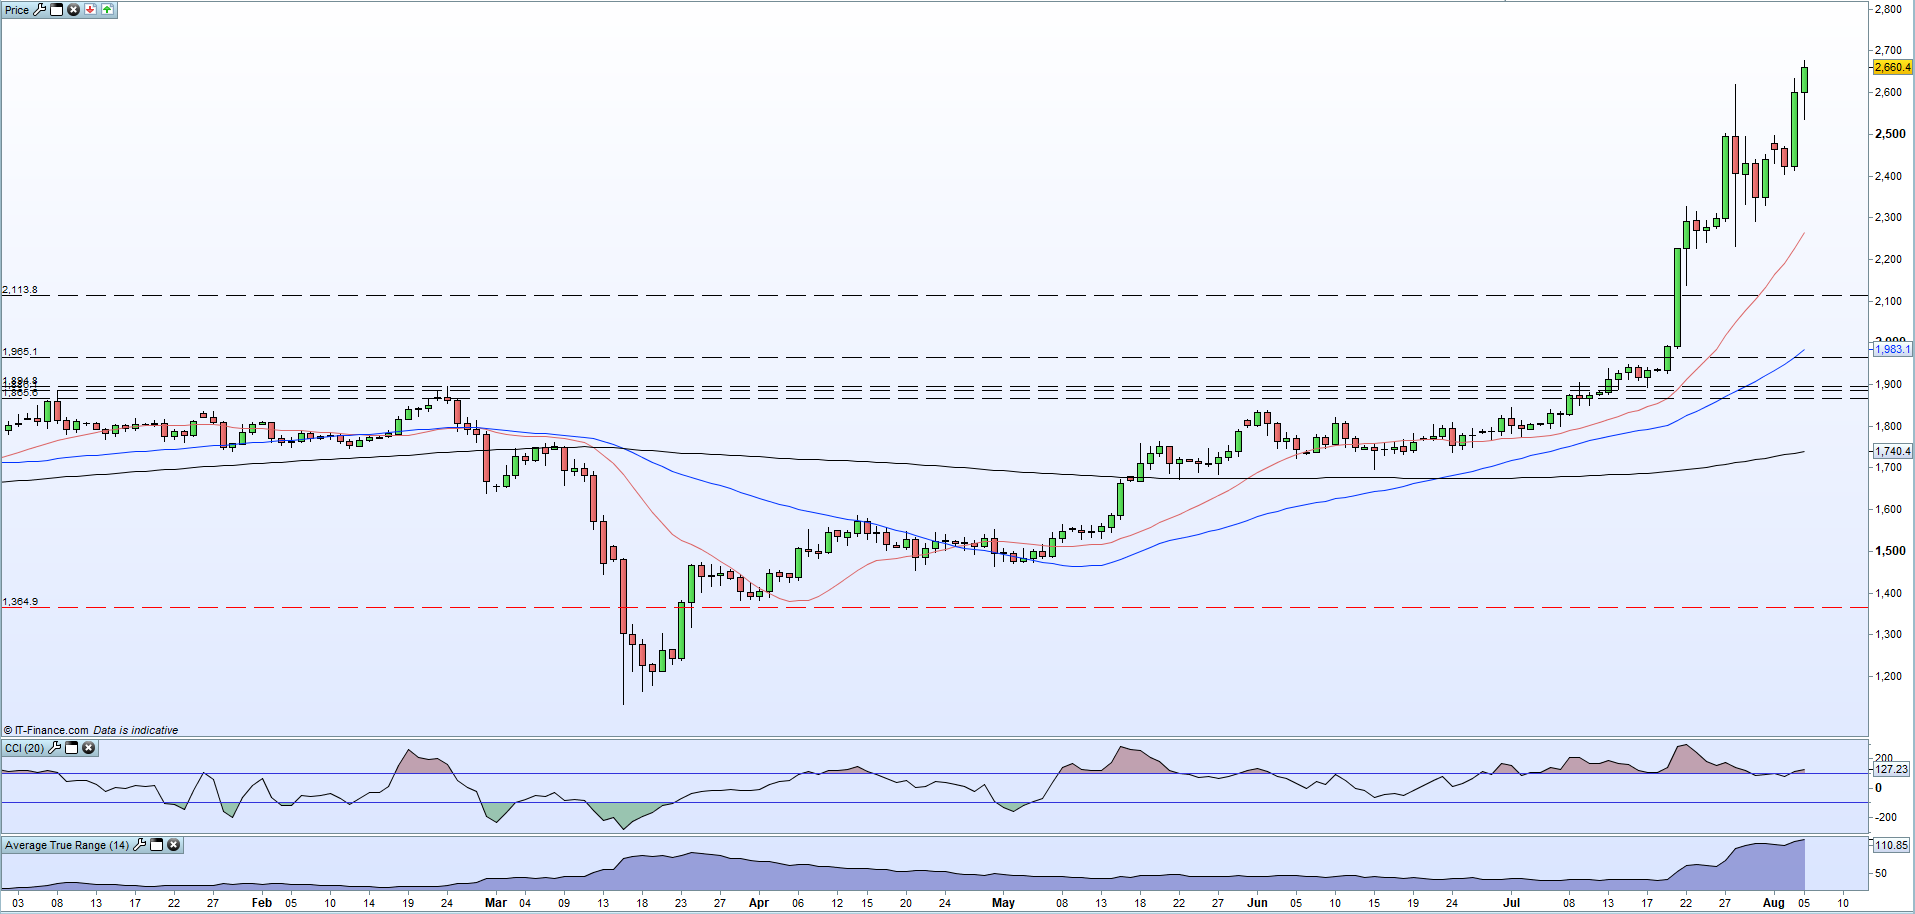
Silver’s performance this year has been even spectacular than gold’s, up nearly 42% year-to-date compared to gold’s 33% ytd. Silver’s performance from the March 16 low is even more impressive, gaining 135% while silver rallied by 34% in July alone. Today’s high at $26.78/oz. is the best level seen in over seven years and the recent sharp move in the precious metal has pushed volatility (ATR) to its highest level in five years due to outsized moves seen from late-July onwards. While gold is at an all-time high, silver is at a seven-year high and needs to nearly double to just under $50/oz. to top the all-time high made in April 2011. The daily chart remains positive, especially after breaking above the bearish engulfing candle made on July 28, and as with gold, any setbacks should be looked at carefully.
SILVER (XAG/USD) DAILY PRICE CHART (JANUARY – AUGUST 5, 2020)
Reprinted from dailyfx, the copyright all reserved by the original author.
免責事項:本記事で述べられている見解は著者の見解のみであり、Followmeの公式見解を反映するものではありません。Followmeは、提供された情報の正確性、完全性、信頼性について一切責任を負いません。また、書面で明示的に記載されている場合を除き、本記事の内容に基づいて行われたいかなる行動についても責任を負いません。

古いコメントはありません。ソファをつかむ最初のものになりましょう。