· Views 690
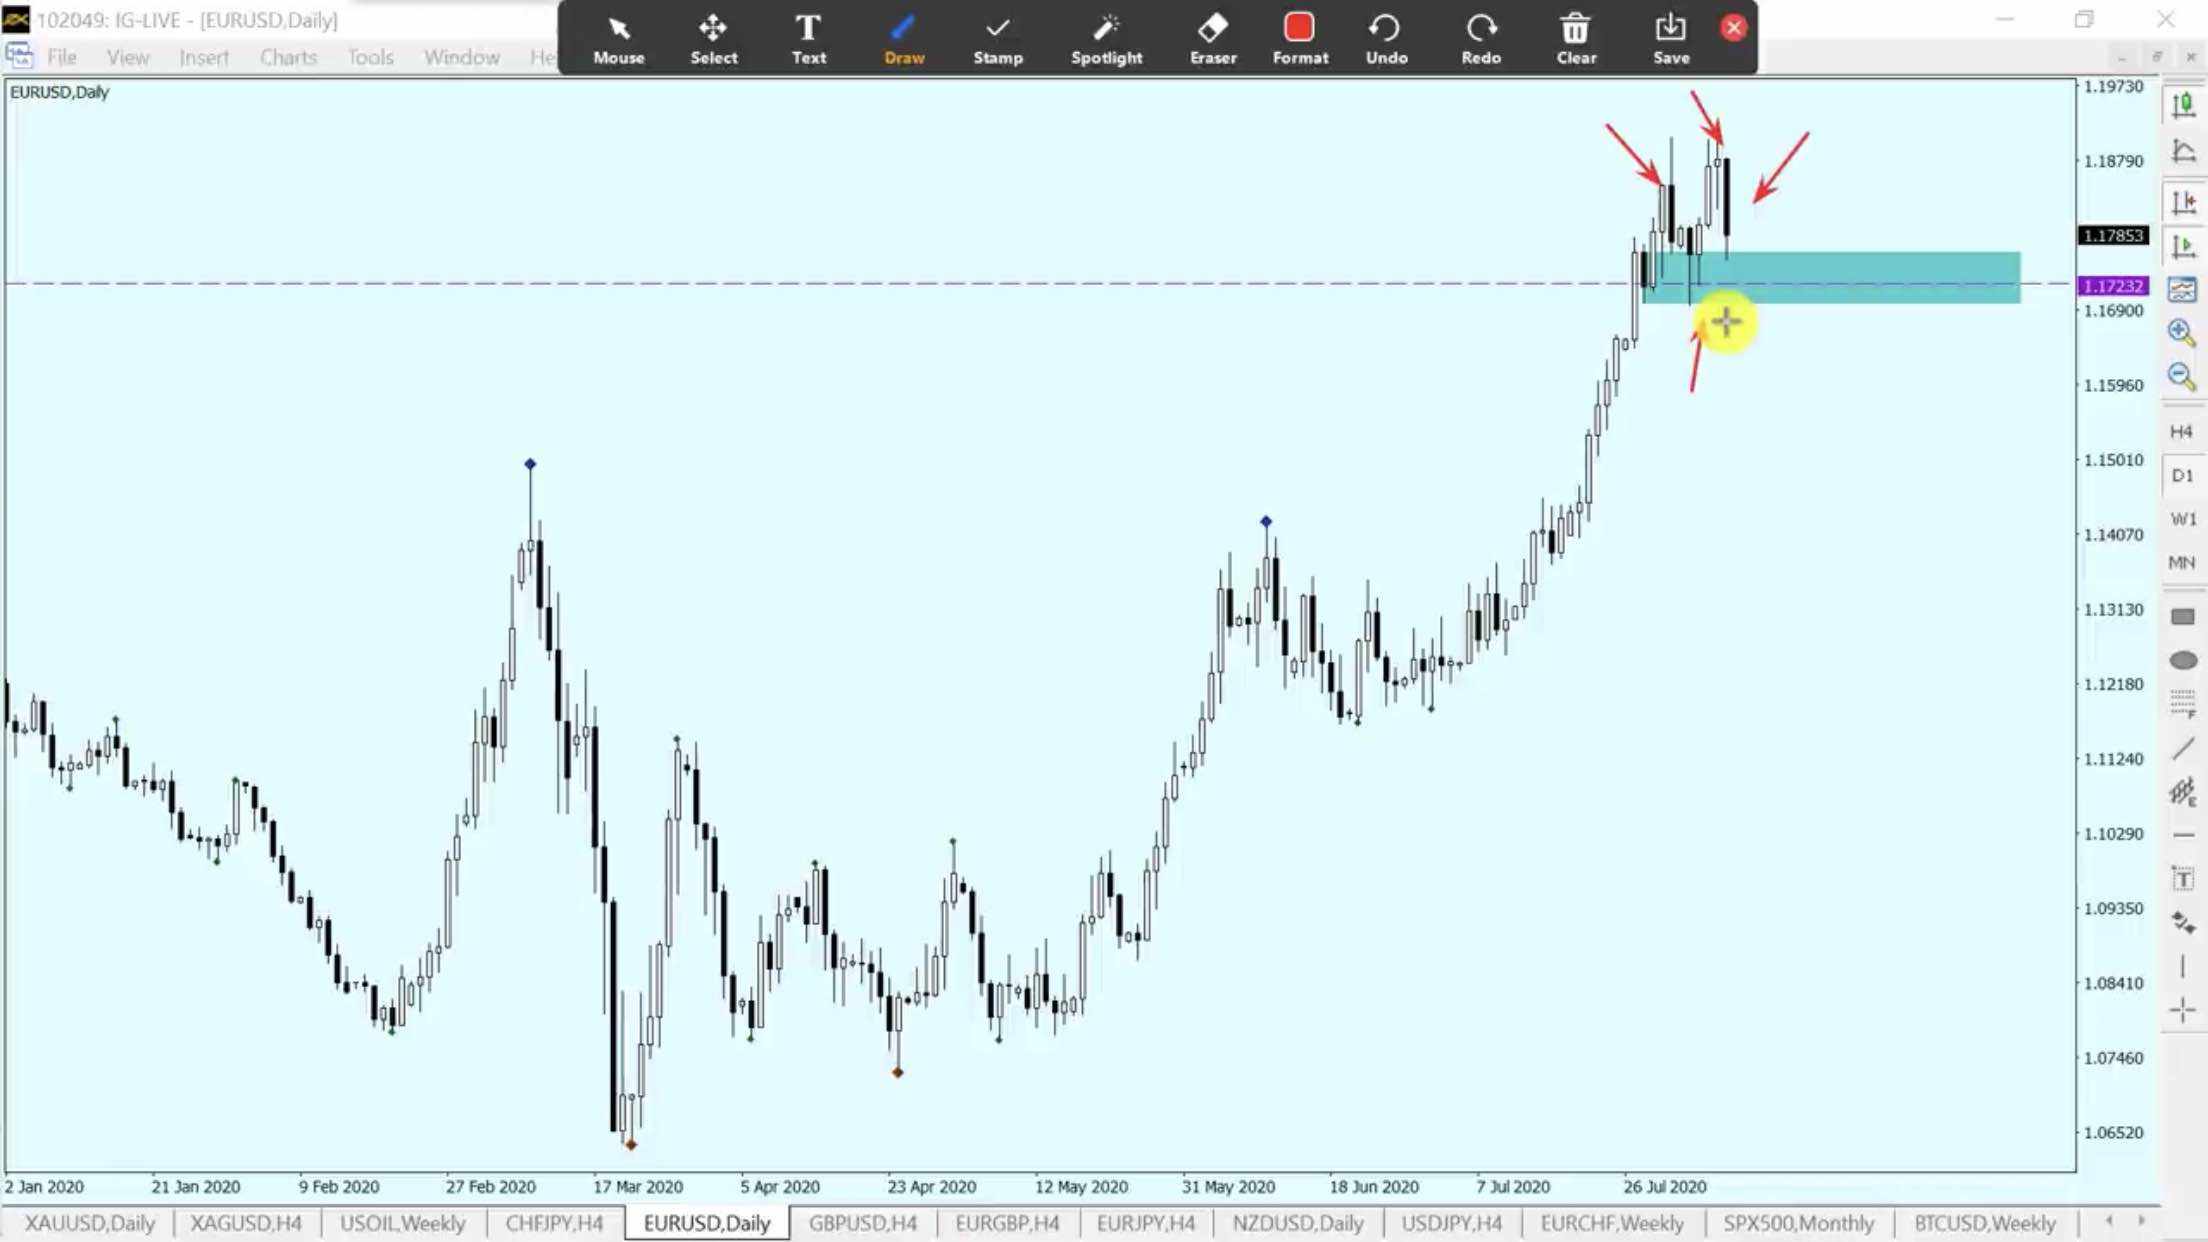
On the daily chart, we can the Selling candles but dont be traped by the market, it's just a re-test candle after a long wave up. There 2 pin bars up we can see on the D1 chart here, that means we can BUY from there.
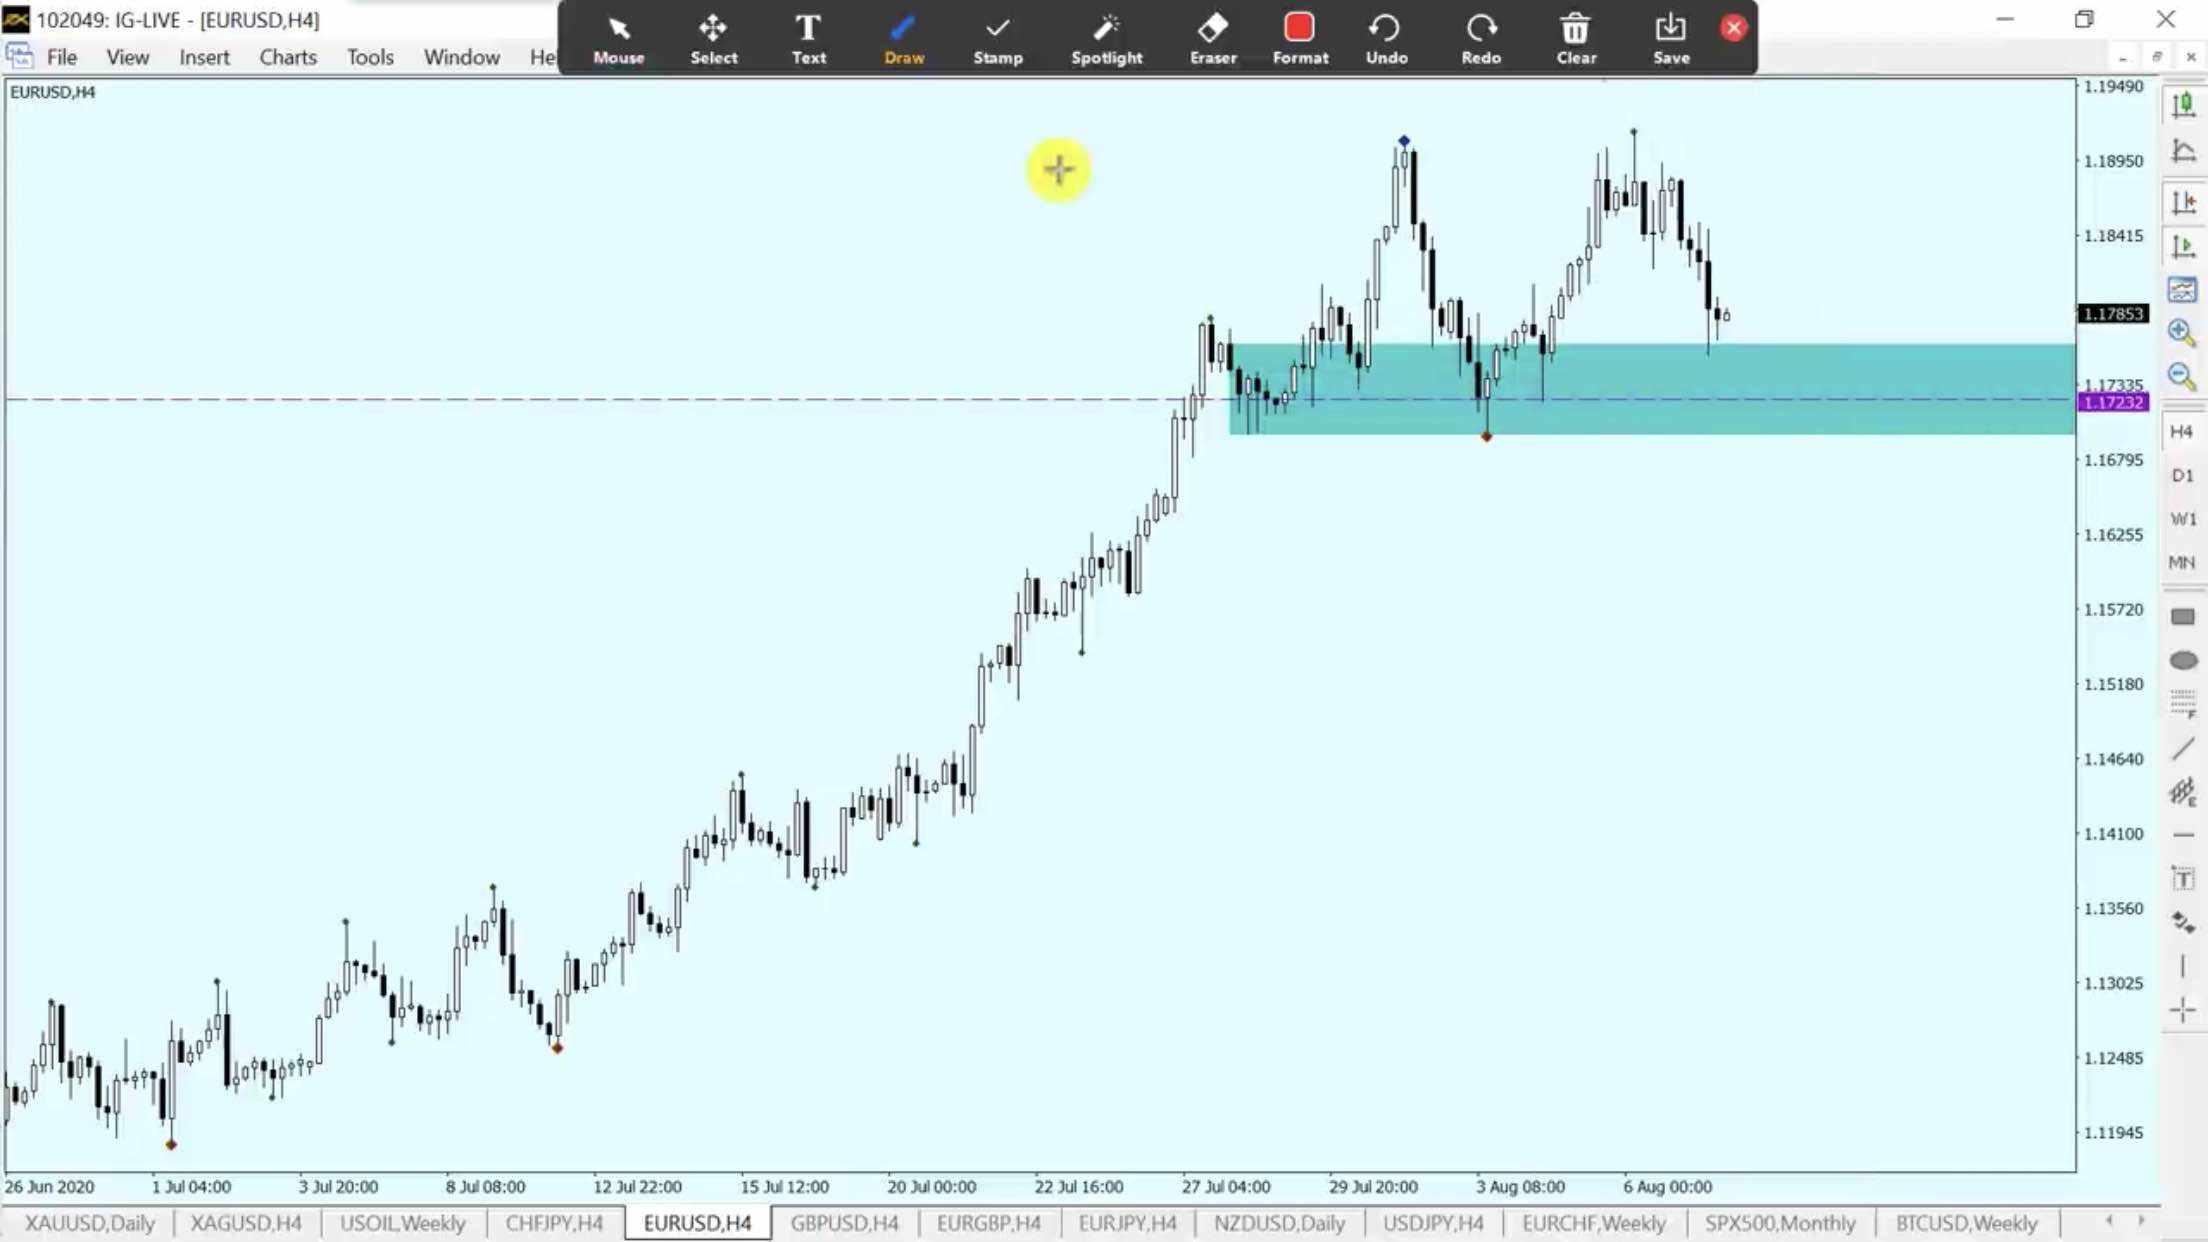
On the H4 chart, we can see clearly about the support area at the price 1.17232. Please wait for the price to arrive this area and a signal like pin bar up or inside bar to Buy.
Or you can BUY Limit at 1.17232, Stop loss at 1.16940, take profit at 1.1920 or 1.2000
This is my own opinion about the market, please always put stop loss to advoid risk.
免責事項:本記事で述べられている見解は著者の見解のみであり、Followmeの公式見解を反映するものではありません。Followmeは、提供された情報の正確性、完全性、信頼性について一切責任を負いません。また、書面で明示的に記載されている場合を除き、本記事の内容に基づいて行われたいかなる行動についても責任を負いません。
この記事が気に入ったら、著者にチップを送って感謝の気持ちを表しましょう。

古いコメントはありません。ソファをつかむ最初のものになりましょう。