AUSSIE DOLLAR VS US DOLLAR TECHNICAL OUTLOOK
- Bulls momentum eased up, but the bias higher remained
- Positive outlook while above 0.7300 threshold
AUD/USD PRICE – BULLS PULLBACK
Last week, AUD/USD hit an 18-month high of 0.7243 and retreated after as some bulls seemed to cut back. Ultimately, a weekly candlestick closed with a Doji pattern highlighting the market’s indecision.
Alongside that, the Relative Strength Index (RSI) fell from 69 to 59 signaling that bulls were losing momentum.
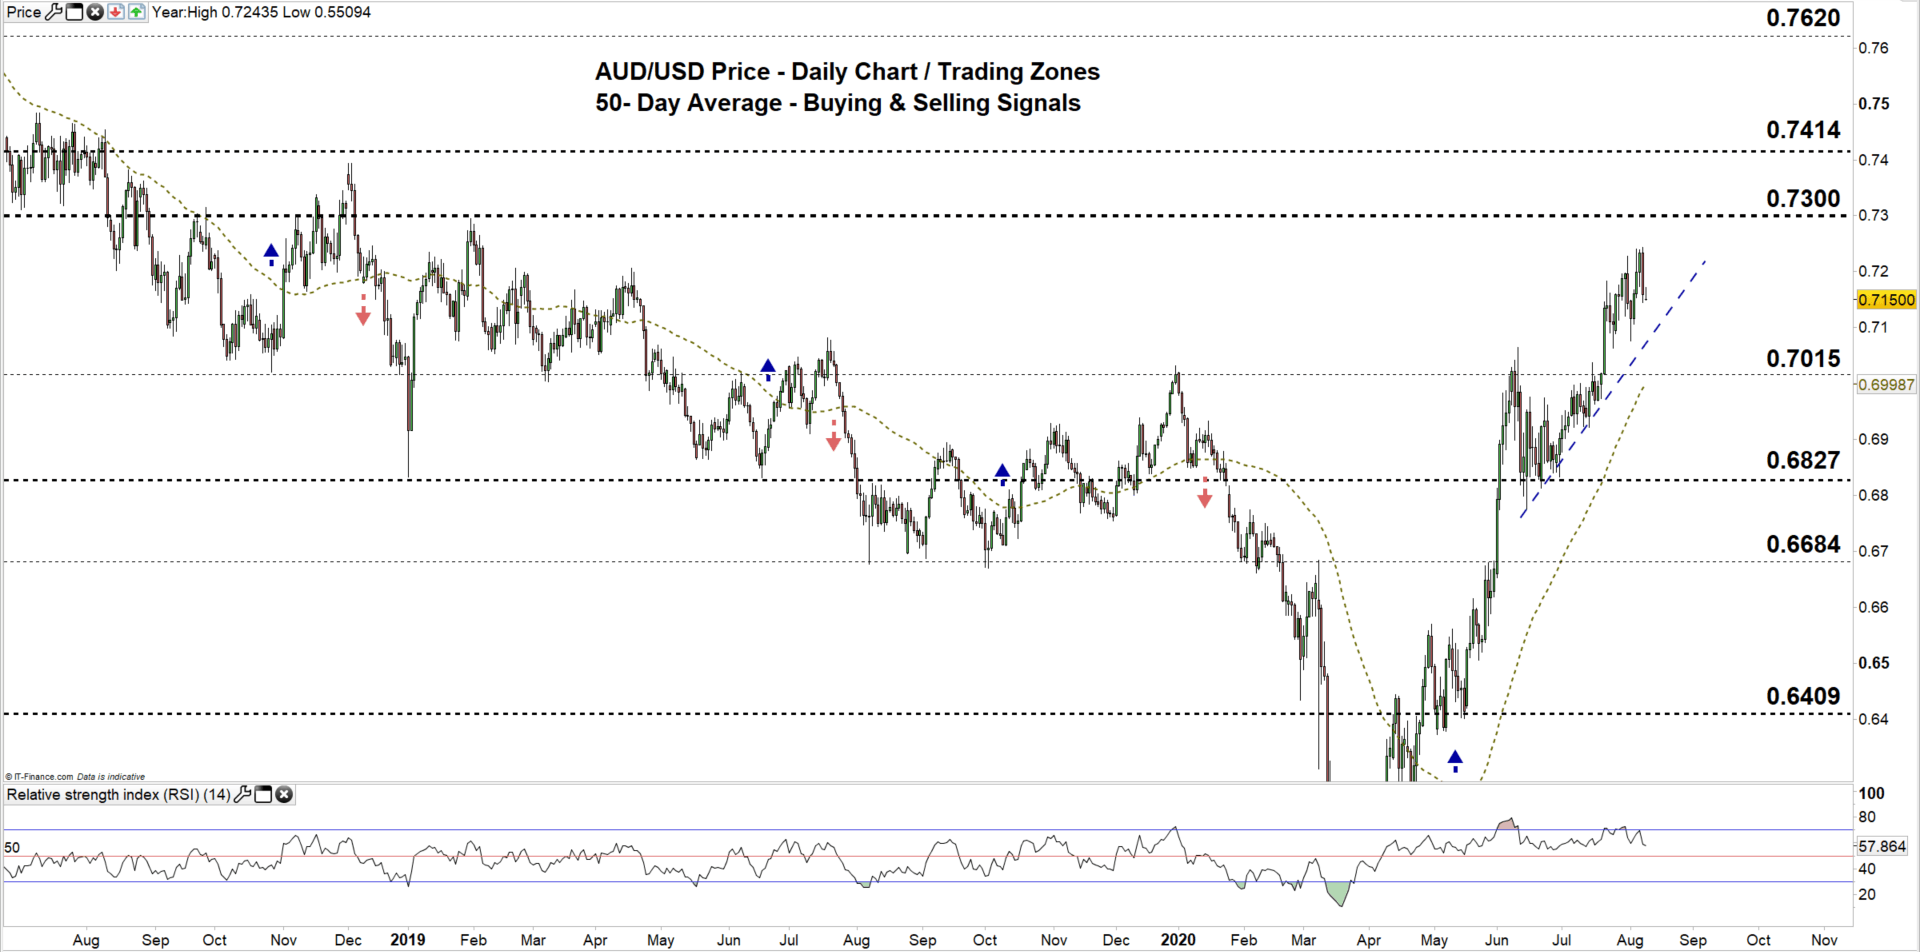
AUD/USD DAILY PRICE CHART (AUG 20, 2018 – AUGUST 10, 2020) ZOOMED OUT
AUD/USD DAILY PRICE CHART (JUNE 25 – AUGUST 10, 2020) ZOOMED IN
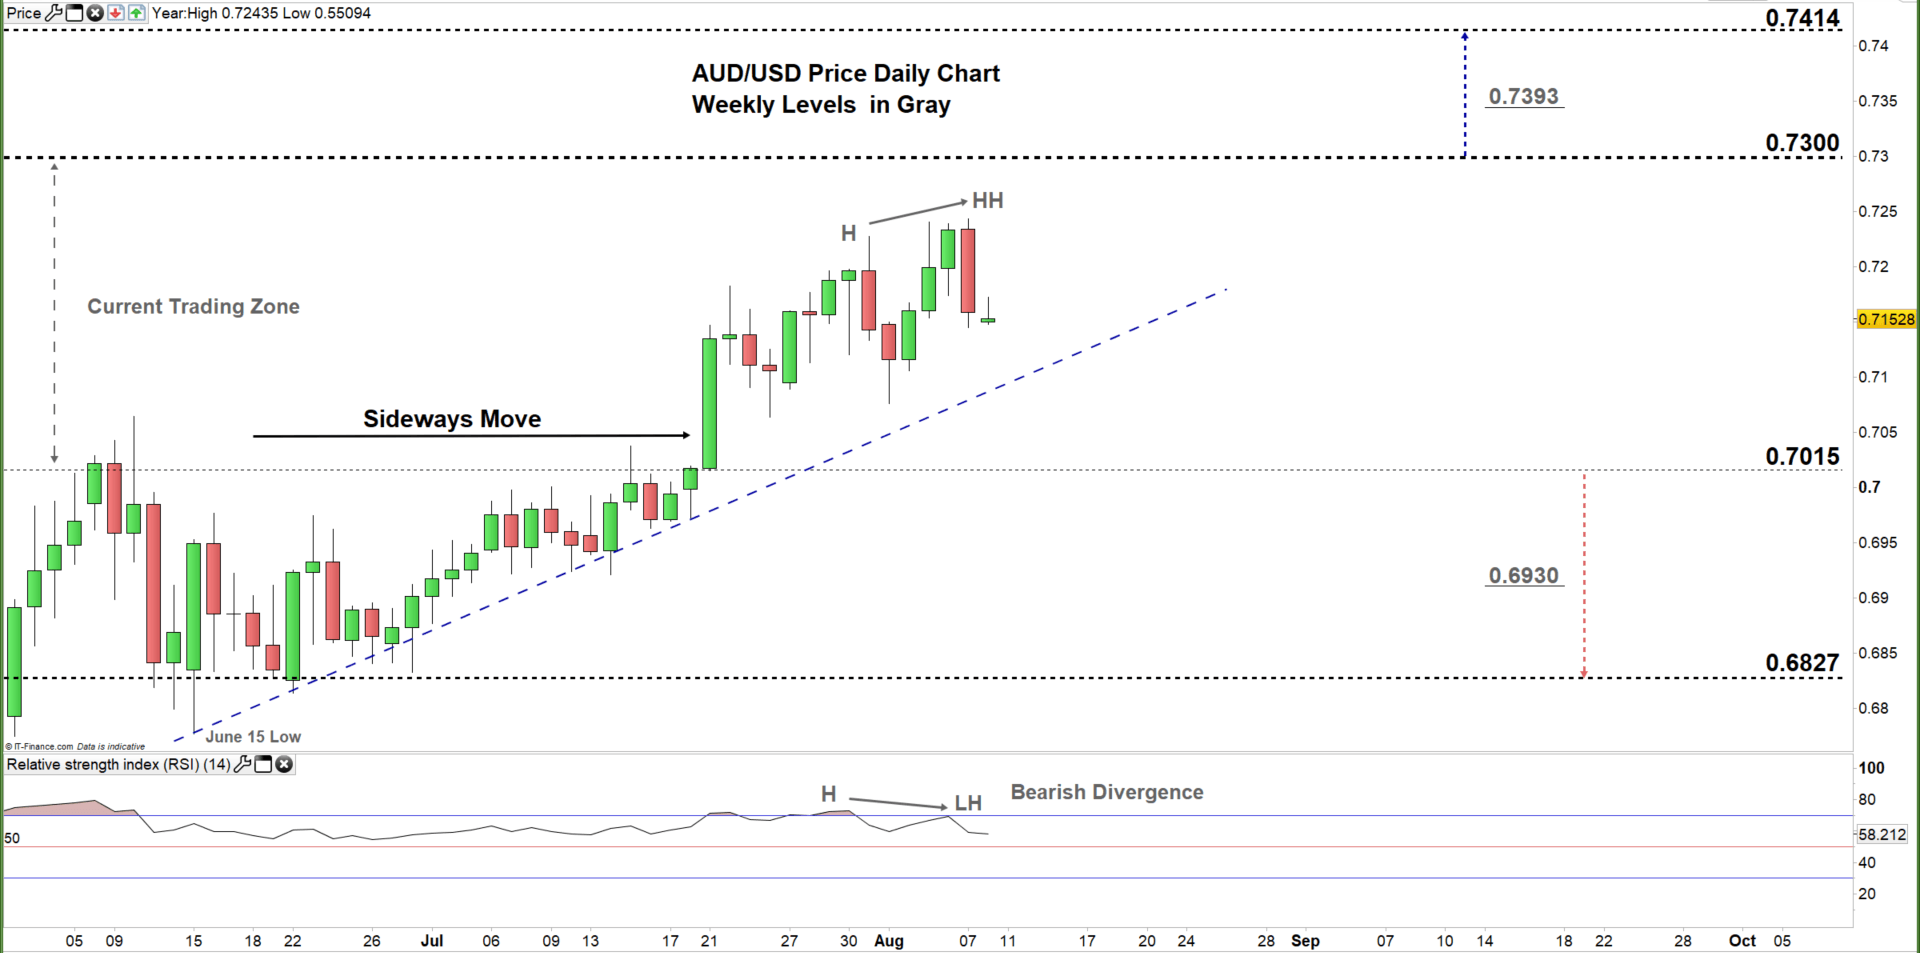
On July 21, AUD/USD ended its previous sideways move and climbed to the current 0.7015- 0.7300 trading zone creating higher highs with higher lows.
However, it’s important to note the price/RSI divergence as the former created a higher high, while the latter created a lower high highlighting a possible reversal of the upward move.
A daily close above the high end of the current trading zone may encourage bulls to extend the rally towards the monthly resistance level at 0.7414 ( May 2018 low).
On the other hand, a failure in closing above the high end of the zone reflects bull’s hesitation and may guide AUDUSD’s fall towards the low end of the zone ( January 2020 high).
AUD/USD FOUR-HOUR PRICE CHART (JUNE 15 – AUGUST 10, 2020)
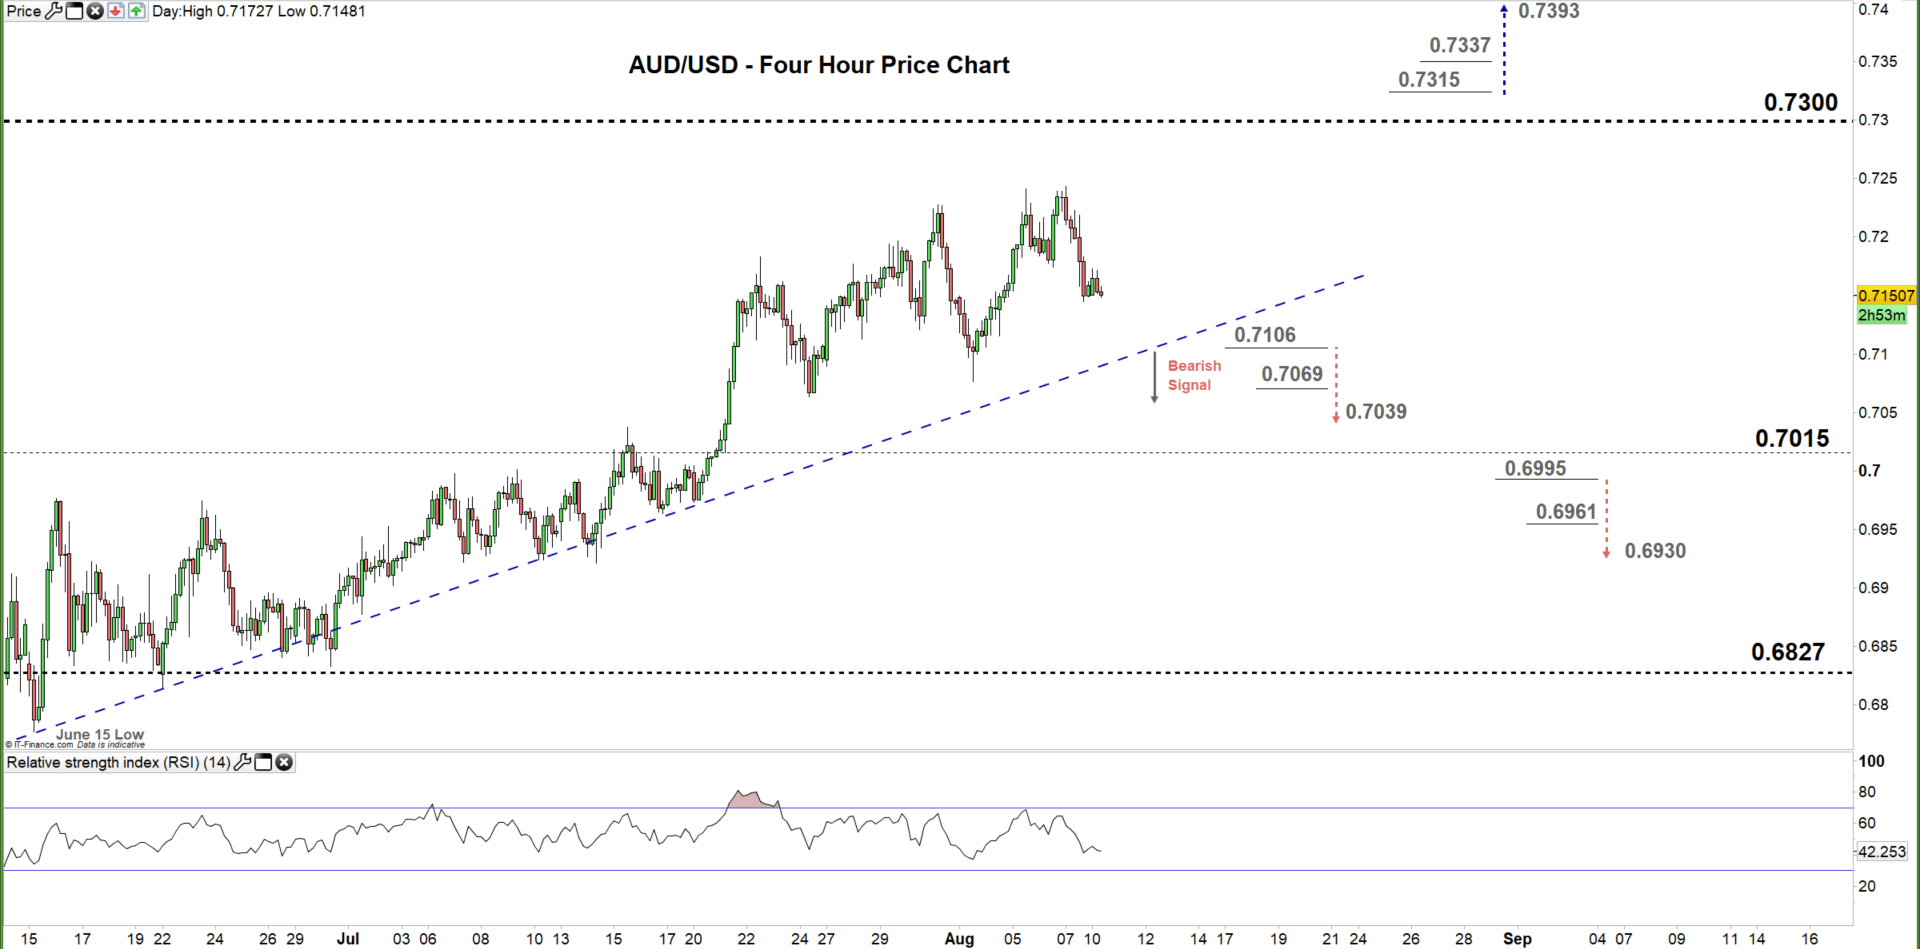
In the middle of July, AUD/USD failed to break below the bullish trendline support originated from the June 15 low at 0.6776 indicating that bulls had the upper hand.
To conclude, while the bullish momentum still in place the bearish divergence discussed above on the daily chart provides a good base of a possible reversal. Additionally, a violation of the aforementioned bullish trendline reflects a weaker upward trend.
Therefore, a break below the 0.7106 could send AUDUSD toward 0.7039, while a break above 0.7315 may cause a rally towards 0.7393. As such, the support and resistance levels marked on the four-hour chart should be considered.
Reprinted from dailyfx, the copyright all reserved by the original author.
免責事項:本記事で述べられている見解は著者の見解のみであり、Followmeの公式見解を反映するものではありません。Followmeは、提供された情報の正確性、完全性、信頼性について一切責任を負いません。また、書面で明示的に記載されている場合を除き、本記事の内容に基づいて行われたいかなる行動についても責任を負いません。

古いコメントはありません。ソファをつかむ最初のものになりましょう。