· Views 2,447
We used the theory of price action in order to conduct this analysis, so that we could guide our decision-making process.
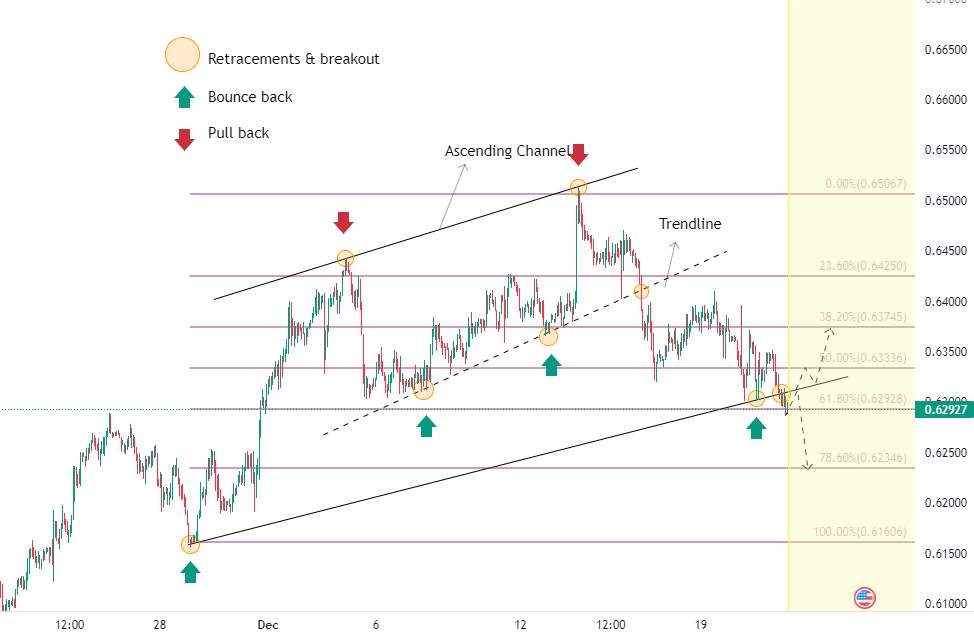
Based on the results of this analysis, we can see that the price is moving upwards while using the ascending channel to do so. In the past several months, the price has given us numerous pullbacks and bounce backs. In addition, the price has also tested the inner trend line in an attempt to complete the uptrend. However, near 0.64096, the price finally broke the inner trend line , giving us a short-term retracement, which gave us a new short-term downtrend. For more accuracy, we use Fibonacci levels. As of today, the price has already broken through the ascending channel and has held the support level of 0.62928 (61.80% of the Fibo). In the following days, we will be able to target the area where we can trade.
1.In the case of a price support moving down, the price is likely to move down and test the next support near 0.62928. If this support is broken, the price will enter a trend.
2.The target area near 0.63336 and 0.63745 is a retracement from the support area and a retest of the channel line; then price closes within the channel.
With this analysis, you will be able to find your most profitable trade, since Enclavefx believes in enhancing the knowledge of our clients & followers.
免責事項:本記事で述べられている見解は著者の見解のみであり、Followmeの公式見解を反映するものではありません。Followmeは、提供された情報の正確性、完全性、信頼性について一切責任を負いません。また、書面で明示的に記載されている場合を除き、本記事の内容に基づいて行われたいかなる行動についても責任を負いません。
この記事が気に入ったら、著者にチップを送って感謝の気持ちを表しましょう。

古いコメントはありません。ソファをつかむ最初のものになりましょう。