In this technical blog, we will look at the past performance of the 1-hour Elliott Wave Charts of USDJPY. In which, the decline from 16 March 2023 high ended 5 waves in an impulse sequence and showed a lower low sequence in a higher time frame charts. Therefore, we knew that the structure in USDJPY is incomplete to the downside & should see more weakness. So, we advised members to sell the bounces in 3, 7, or 11 swings at the extreme areas. We will explain the structure & forecast below:
USDJPY 1 Hour Elliott Wave Chart From 3.27.2023
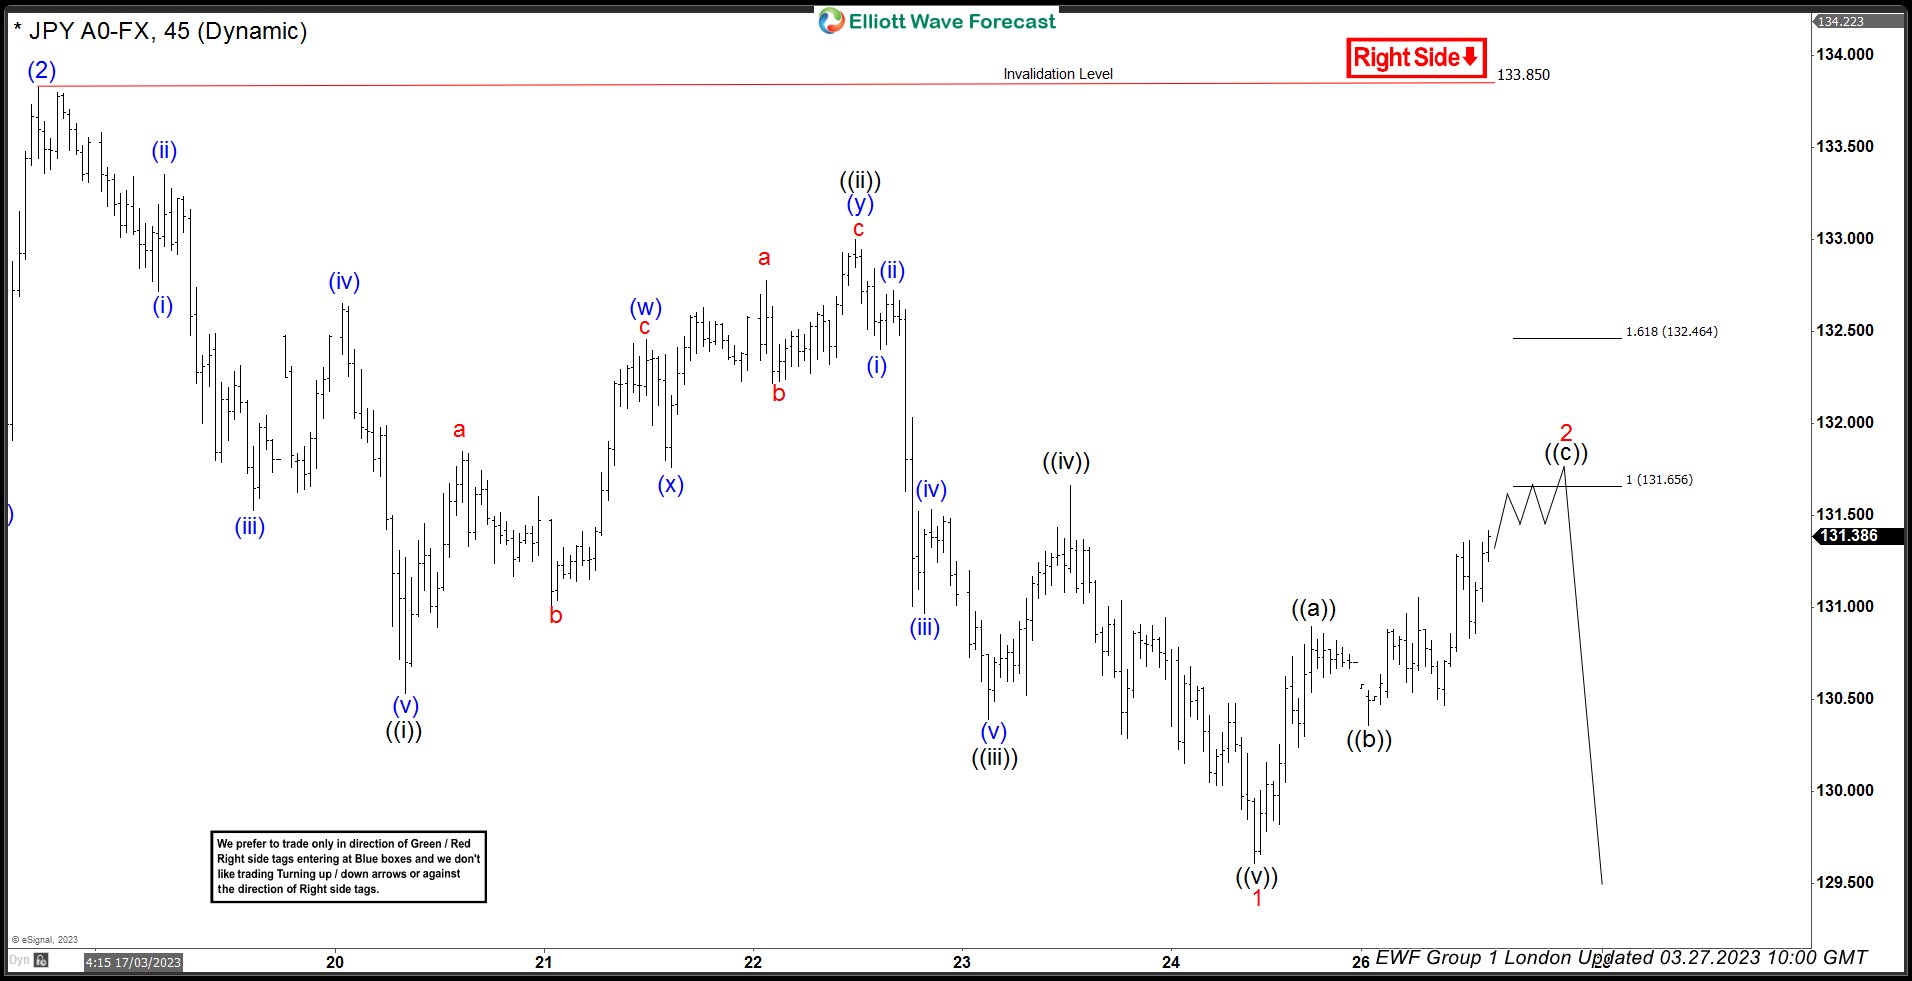
Above is the 1hr Elliott wave Chart from the 03/27/2023 London update. In which, the decline from 16 March unfolded in an impulse sequence & showed a lower sequence where the pair made a short-term bounce in wave 2. The internals of that bounce unfolded as an Elliott wave zigzag correction where wave ((a)) ended at $130.89 high. Then a decline to $130.35 low ended wave ((b)) pullback and started the ((c)) leg higher towards $131.65- $1132.46 equal legs area from where sellers were expected to appear looking for more downside or for a 3 wave reaction lower at least.
USDJPY Latest 1-Hour Elliott Wave Chart From 3.28.2023
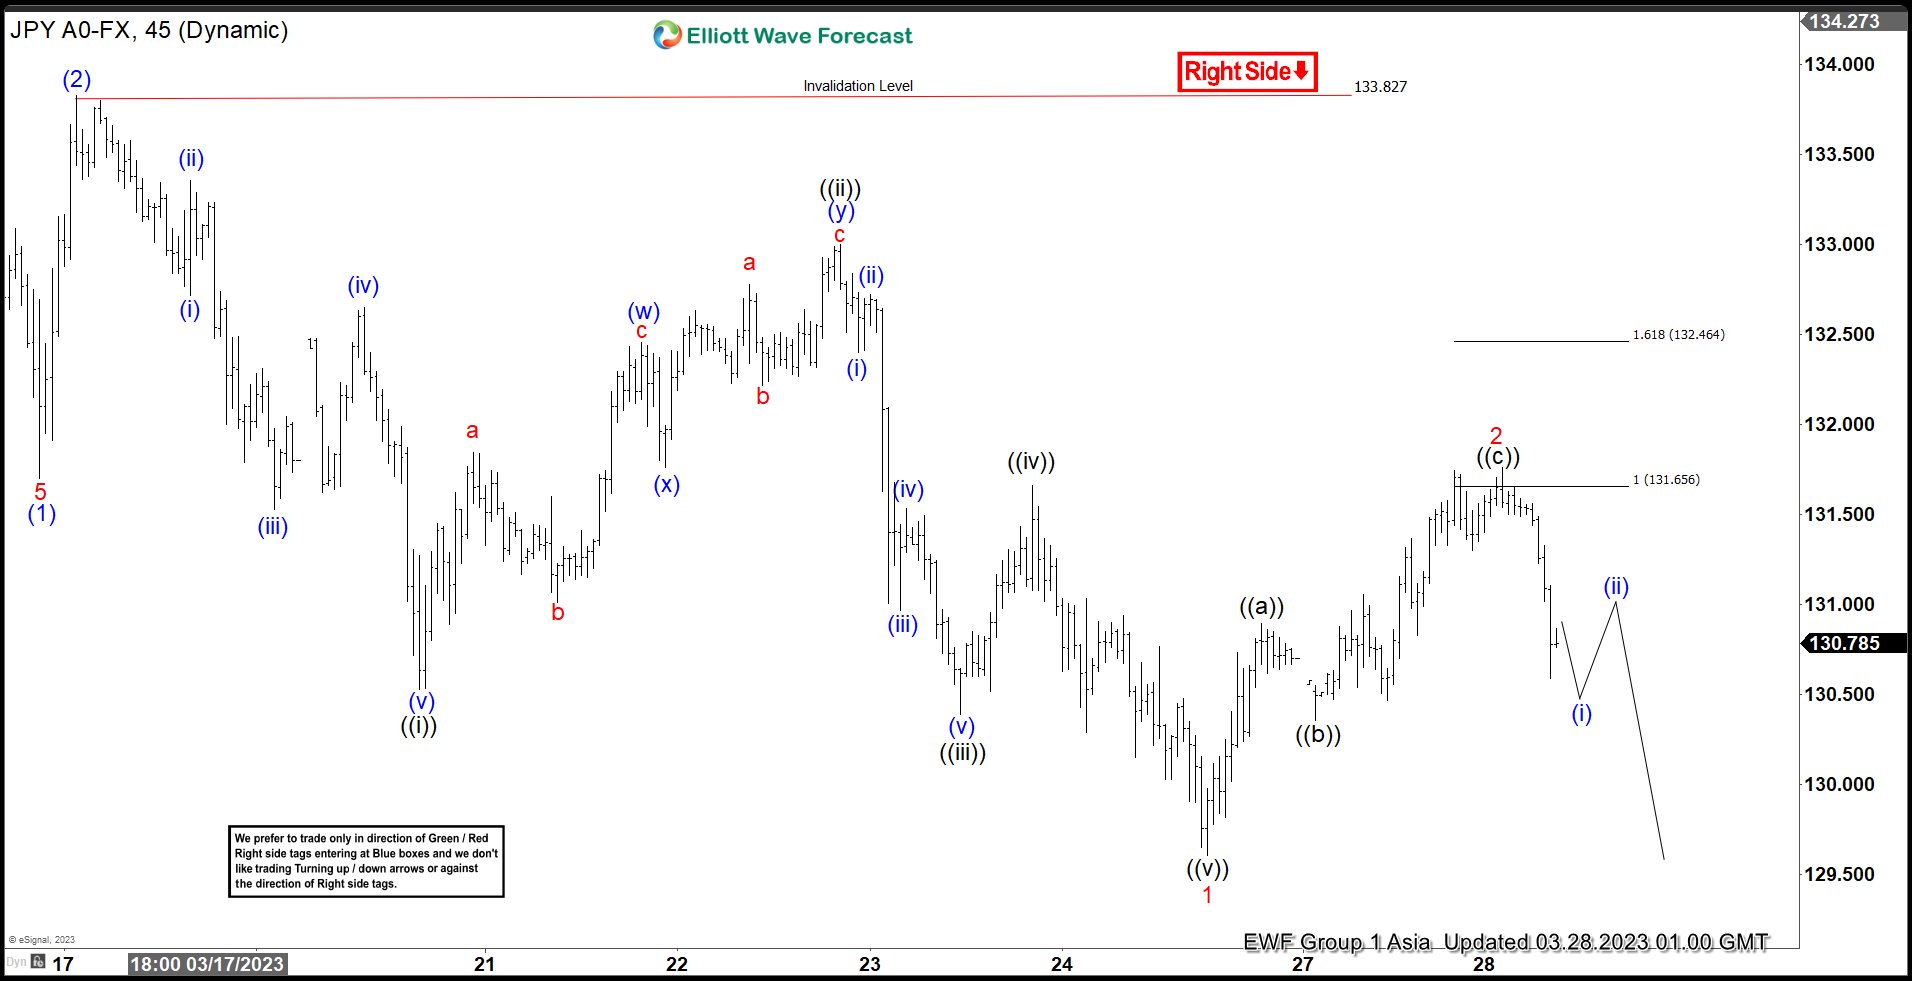
This is the Latest 1hr view from the 03/28/2023 Asia update. In which the pair is showing a reaction lower taking place from the equal legs area allowing shorts to get into a risk-free position shortly after taking the position. However, a break below $129.61 low is still needed to confirm the next extension lower & avoid a double correction higher.
免責事項:本記事で述べられている見解は著者の見解のみであり、Followmeの公式見解を反映するものではありません。Followmeは、提供された情報の正確性、完全性、信頼性について一切責任を負いません。また、書面で明示的に記載されている場合を除き、本記事の内容に基づいて行われたいかなる行動についても責任を負いません。

古いコメントはありません。ソファをつかむ最初のものになりましょう。