• The dollar index has been accumulating substantial bullish strength in the past 3 trading sessions.
• In the previous trading session, the index made highs of 102.21 after it gave a bullish breakout above the ascending wedge pattern and above the immediate resistance at 101.67.
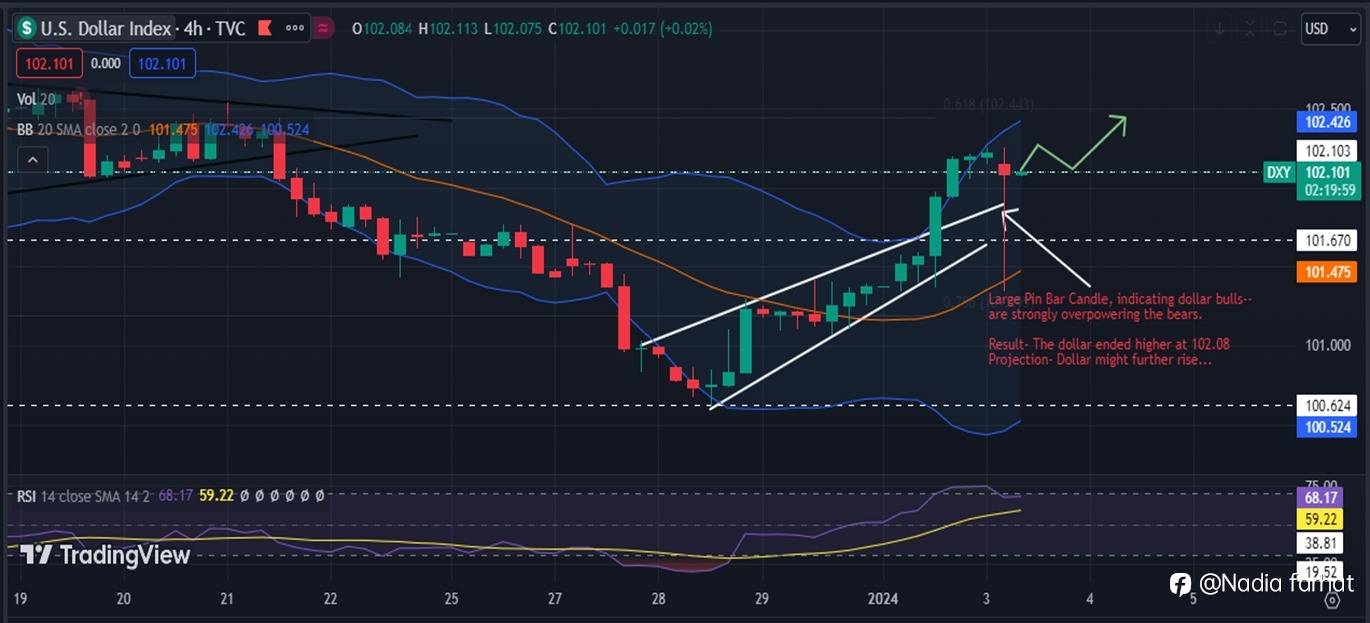
• However, the index looks steady on Wednesday near the 102.15 level.
• Although volatility remains high in the index as we can see a large pin bar candle on the 4H chart, making lows of whooping 101.34, but the candle closed higher at 102.08.
• It signals that dollar bulls are strongly overpowering the bears.
*Economic Events*
• On Tuesday, important *S&P Global US Manufacturing PMI (Dec)* rose lower by 47.9 as compared to previous 49.4. It is likely to note that a reading below 50 indicates a contraction in the sector.
• *US Treasury Yield rose – gave a boost to US dollar*: Yields on the rate-sensitive two-year Treasury rose 0.07 percentage points to 4.32 percent, while the yield on the 10-year
*Current Situation:* On Wednesday, the US dollar index remains steady, staying above the 102 mark after a notable 0.8% increase in the preceding session.
*Technical Analysis*
• The index is moving above the middle band of the Bollinger band. Prices are also trending in the buying zone of the RSI indicator.
• Both indicators are indicating bullishness.
*Important Levels to Watch:*
• Support: 102.0 and 101.67 will be important support levels
• Resistance: 102.25 – the intraday highs will act as important resistance, above which levels could reach 102.45
To get such analysis on a daily basis. DM me
免責事項:本記事で述べられている見解は著者の見解のみであり、Followmeの公式見解を反映するものではありません。Followmeは、提供された情報の正確性、完全性、信頼性について一切責任を負いません。また、書面で明示的に記載されている場合を除き、本記事の内容に基づいて行われたいかなる行動についても責任を負いません。

古いコメントはありません。ソファをつかむ最初のものになりましょう。