-
The XAU/USD chart was unable to break above the resistance trend line (orange) and is now testing the support trend line (green).
-
Price action seems to be building 3 corrective waves down after 5 impulsive waves up. Now an ABC zigzag pattern seems to be taking place in wave 2 or B.
-
The target is the previous top. A break below the 100% Fib places the bullish ABC or 123 (pink) on hold (orange sign).
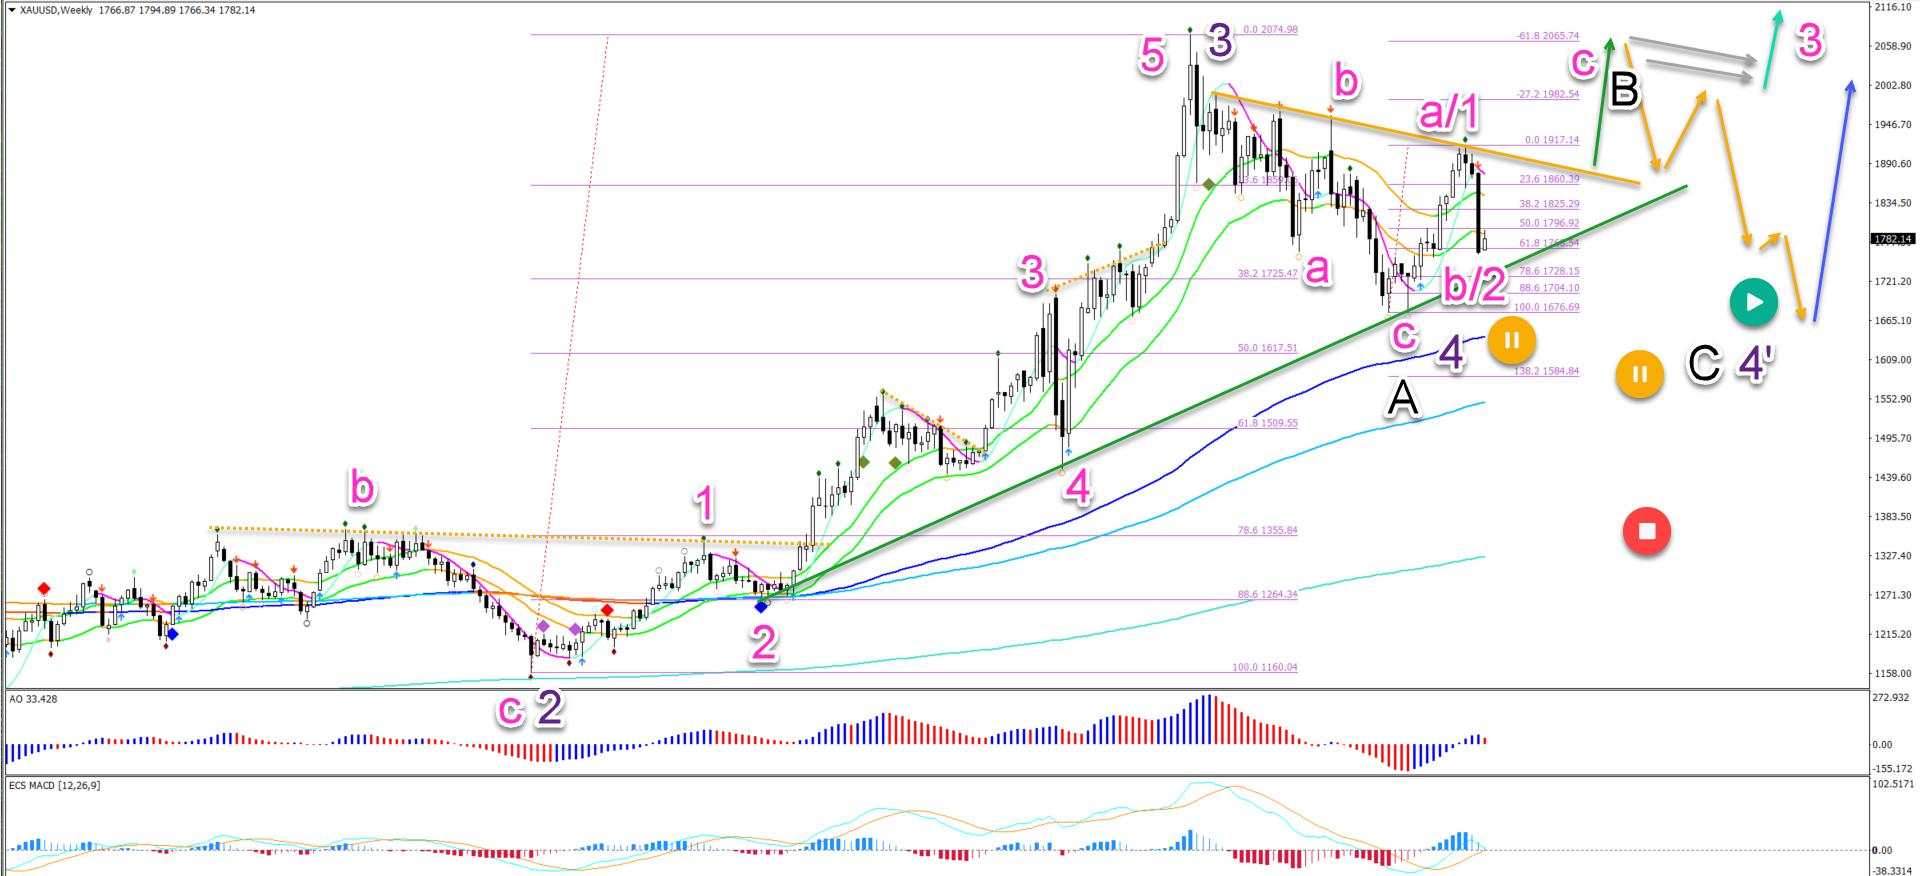
The XAU/USD (Gold) weekly chart made a bearish reversal contrary to our previous analysis. This indicates that price action has either completed a wave 1 or A (pink).
This article analyzes what to expect from the wave 4 retracement (purple).
Price charts and technical analysis
The XAU/USD chart was unable to break above the resistance trend line (orange) and is now testing the support trend line (green):
-
A bullish bounce at the support line (green) and 61.8%, 78.6% or 88.6% Fibonacci retracement levels of the wave B/2 (pink) could confirm one more bullish swing.
-
The target is the previous top. A break below the 100% Fib places the bullish ABC or 123 (pink) on hold (orange sign).
-
If price action gets close to the previous top, then the price reaction will be very important.
-
A bull flag (grey arrows) pattern could indicate more uptrend (aqua blue arrow).
-
A bearish reversal (orange arrows) could indicate a bearish ABC (black) pattern in wave 4’ (purple).
-
Any deeper retracement places the uptrend on hold (orange and red signs).
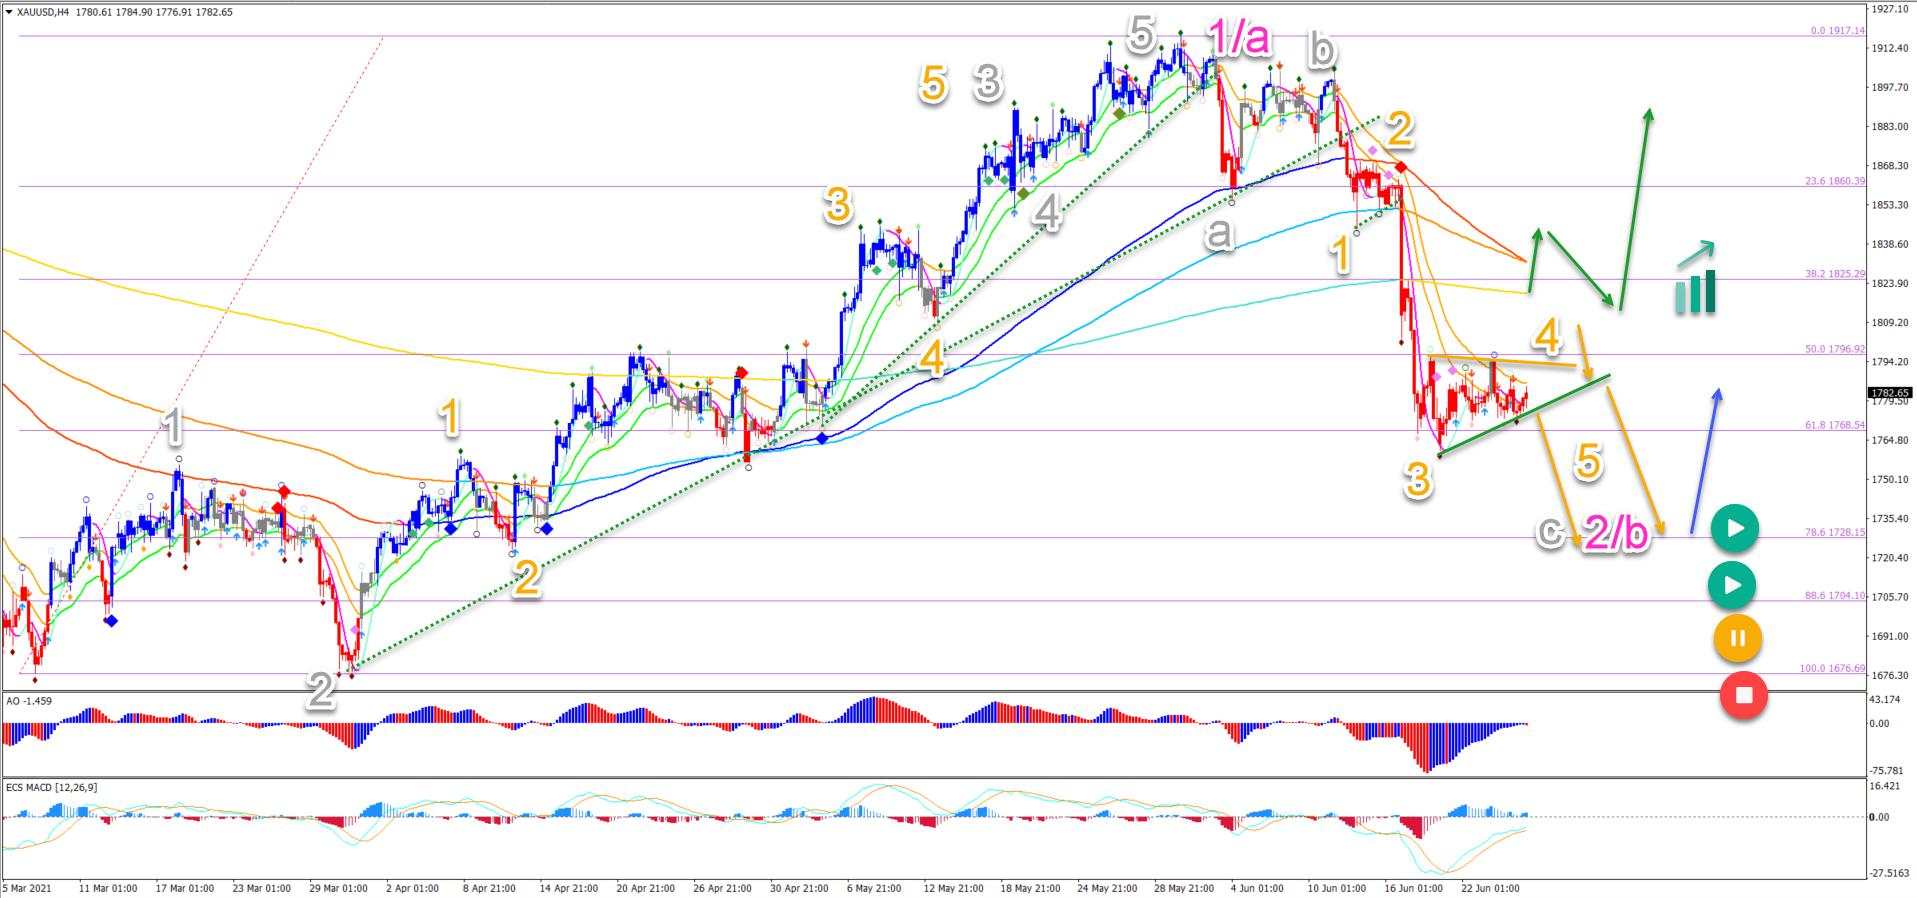
On the 4 hour chart, price action seems to be building 3 corrective waves down after 5 impulsive waves up:
-
The 5 bullish waves (grey) completed a wave 1 or A (pink).
-
Now an ABC (grey) zigzag pattern seems to be taking place in wave 2 or B (pink).
-
A bearish breakout (orange arrows) below the support line (green) could aim at the 78.6% Fibonacci level.
-
A bullish bounce (blue arrow) at the deep Fibonacci retracement levels is expected.
-
A bullish breakout above the long-term moving averages could indicate the end of the bearish ABC (grey) as well and the start of a bullish price swing.
The analysis has been done with the ecs.SWAT method and ebook.
FXStreetから転載、著作権はすべて原作者に帰属します。
免責事項:本記事で述べられている見解は著者の見解のみであり、Followmeの公式見解を反映するものではありません。Followmeは、提供された情報の正確性、完全性、信頼性について一切責任を負いません。また、書面で明示的に記載されている場合を除き、本記事の内容に基づいて行われたいかなる行動についても責任を負いません。

古いコメントはありません。ソファをつかむ最初のものになりましょう。