


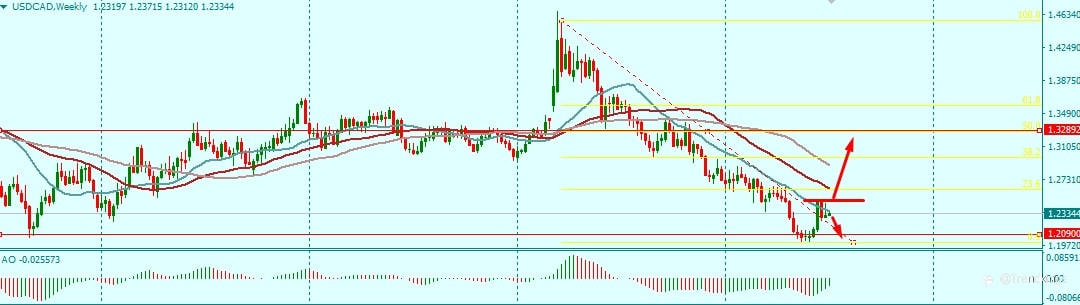
For the past 1 year, USDCAD Weekly has been on a classic downtrend. On March 2020, Price found a major resistance at 1.4642, and from the weekly candle view, price has repeated a perfect LL and LH pattern and has formed below the EMAs till date. Price hits 1.2090 monthly support level, forming a LL where price retraced to 1.2490 which is another key resistance level. Price at 1.2490 respects not only the 20 EMA, but it’s also in symmetry with a previous LH.
In my opinion there are various possible outcomes for the USDCAD; price may fall to form a double bottom; Price may breakout to the upside as the current weekly LL was formed at a strong Monthly Support level, there has also been a breakout of a weekly trend line. Who knows if the current climatic condition in Canada may also weaken its currency?
Disclaimer: What I have shared above is not a financial or investment advice of any sort, it’s just for educational purposes only, whatever trading decision you make is at your own risk.
免責事項:本記事で述べられている見解は著者の見解のみであり、Followmeの公式見解を反映するものではありません。Followmeは、提供された情報の正確性、完全性、信頼性について一切責任を負いません。また、書面で明示的に記載されている場合を除き、本記事の内容に基づいて行われたいかなる行動についても責任を負いません。

