The EUR/NZD , patter has formed a key level in sec. The below line shows possible breakout in daily chart, while the other shows bearish movement yet to come. Seeing the candles in triangle it forms lucrative support at top of triangle and also some double top pattern too. But the candle failed to close equal or below the previous bull candle. And the day end in support black line. A possible reversal too.
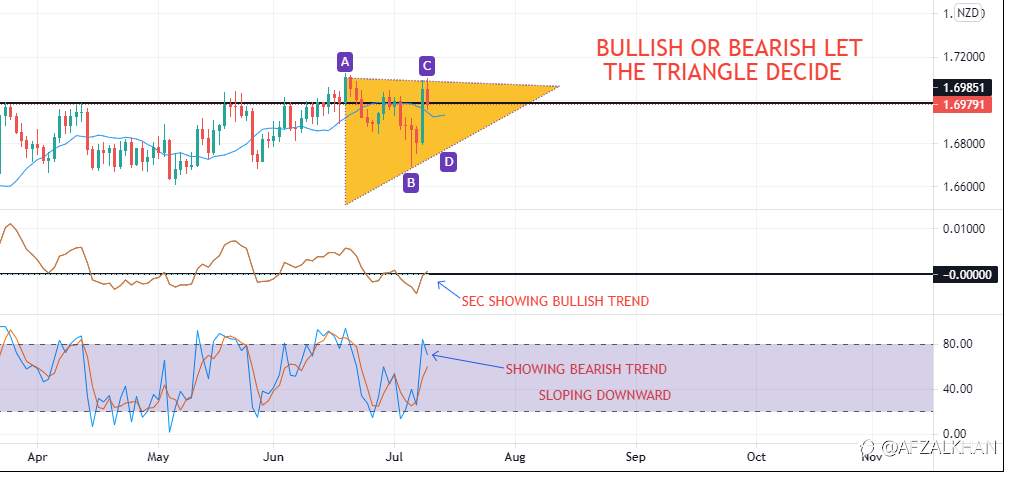
The surprise is possibility is on both sides. Note that the chart is daily chart , and if we possibly see the direction of triangle break , we can have a big move. It may take some days as its on daily chart. My 2 powerful indications are bullish , while other odds say bearish. I think it will be a game to watch this two conditions of bull or bear. What i think the very next session would be very much excited. I am on Bull side in next trading session at 1.69791 Because i support my SEC factor a lot. Lets hope for the best and The most important trend we will come to know after few days when price moves and breaks triangle in either of direction. #OPINIONLEADER##FX##EUR/NZD##trading##imTrader交易大赛##Vietnamesetraders##NewTraders##forextrading#.
11 Jul 2021, 01:01 を編集しました
免責事項:本記事で述べられている見解は著者の見解のみであり、Followmeの公式見解を反映するものではありません。Followmeは、提供された情報の正確性、完全性、信頼性について一切責任を負いません。また、書面で明示的に記載されている場合を除き、本記事の内容に基づいて行われたいかなる行動についても責任を負いません。