


#OPINIONLEADER# The pound is higher on the day after the Bank of England laid out plans for reversing emergency stimulus measures and raising rates. But it hasn’t really changed much as far as the charts are concerned.
Price action continues to push against the key fib levels, as well as the 55/89 daily SMA band, but is there any indication that we’re about to witness a breakout moment?
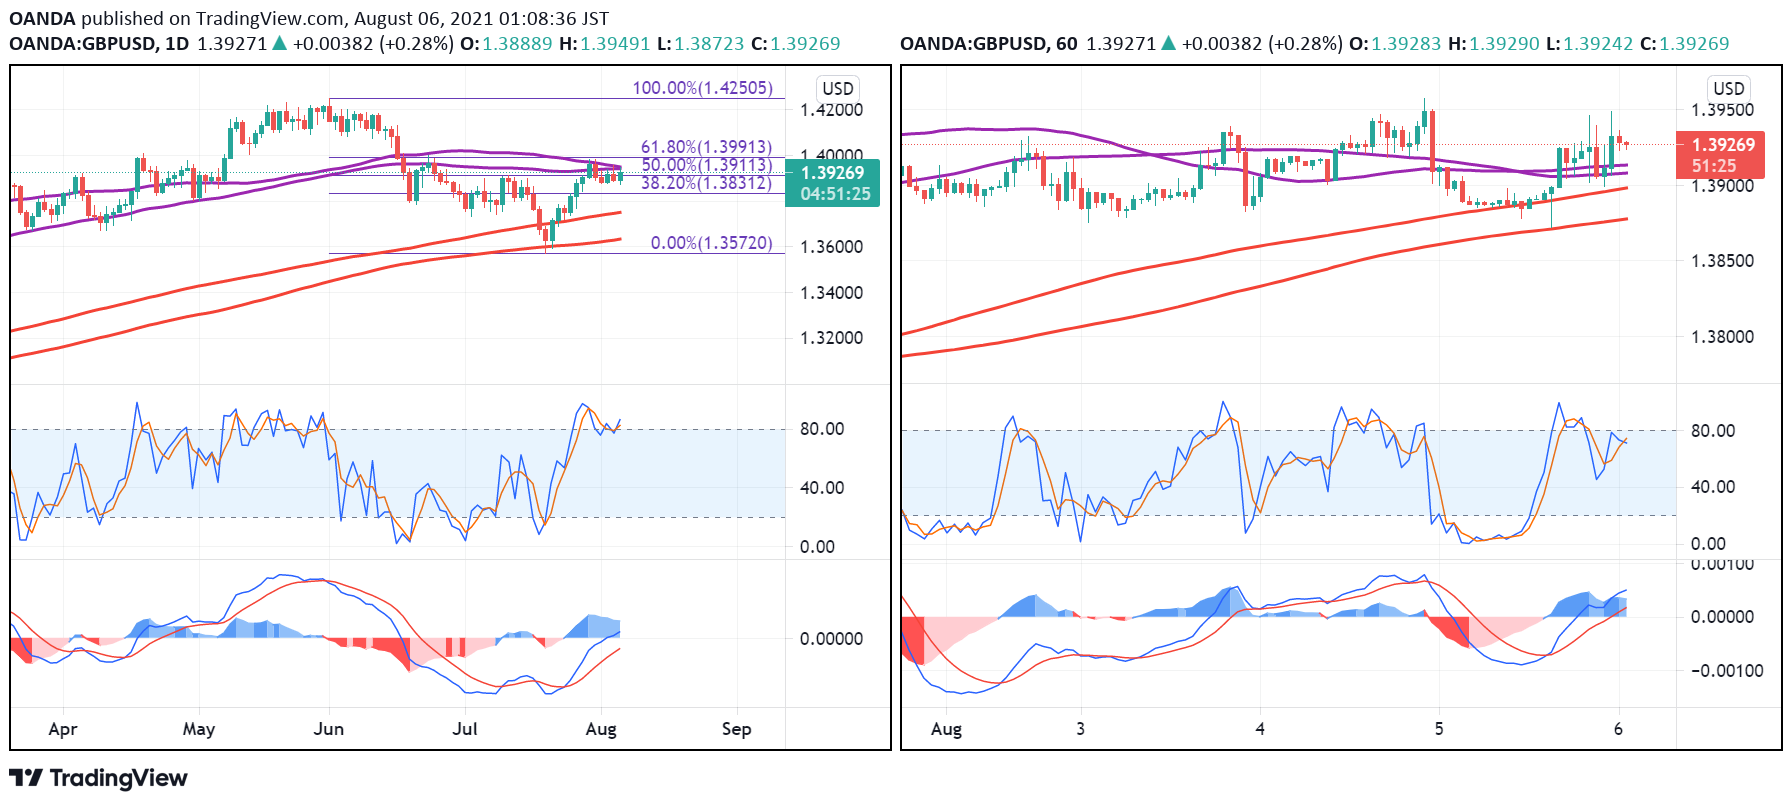
I’m not overly inspired by the action on the lower timeframes.The 4-hour chart isn’t particularly bullish and in fact, the long upper wicks on the last two candles is arguably a bearish signal.
The hour chart shows the rally building throughout the day, since finding support around the 200/233 SMA band, which could be viewed as bullish.
But a look at the momentum indicators – MACD and stochastic – don’t fill me with hope. While price has been building throughout the day, momentum has not. In fact, the stochastic displays a clear divergence.
While divergences aren’t bearish indicators, per say, coming around key resistance on the daily chart does strike me as a big red flag. Especially after the BoE has just offered improved forecasts for growth and unemployment, while laying out a plan for reducing asset purchases and raising rates. .#OPINIONLEADER#
免責事項:本記事で述べられている見解は著者の見解のみであり、Followmeの公式見解を反映するものではありません。Followmeは、提供された情報の正確性、完全性、信頼性について一切責任を負いません。また、書面で明示的に記載されている場合を除き、本記事の内容に基づいて行われたいかなる行動についても責任を負いません。

