


· Views 288
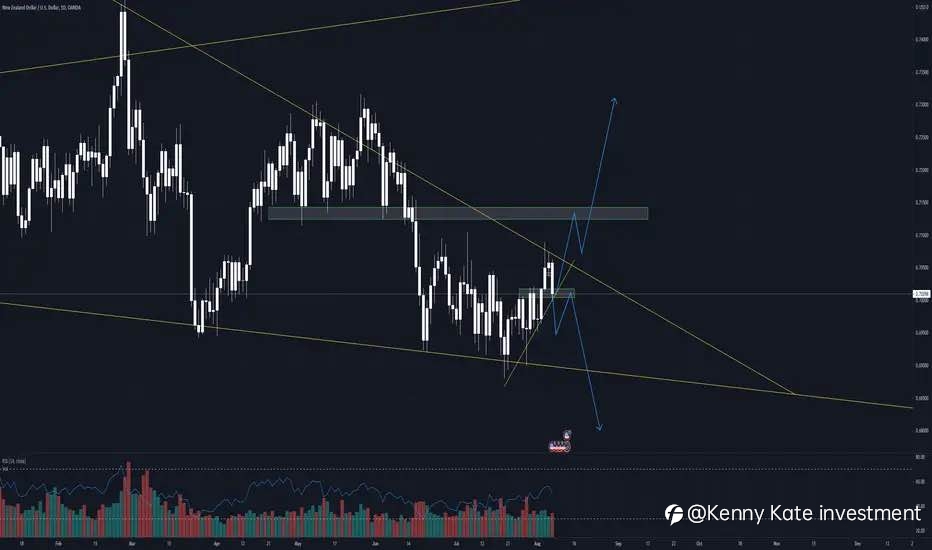
On this daily chart of NZDUSD , I am seeing a wedge pattern for this pair. So far, it is creating higher lows in the lower time frames (30 minutes,1 and 4 hour). As long as it holds this area around 0.7010 where my green rectangle is, I would be leaning more towards it breaking out. However, if it breaks below that, then there's a likelihood of NZDUSD coming down to re-test the lows around 0.6900.
We'll see next week and good luck trading!
We'll see next week and good luck trading!
免責事項:本記事で述べられている見解は著者の見解のみであり、Followmeの公式見解を反映するものではありません。Followmeは、提供された情報の正確性、完全性、信頼性について一切責任を負いません。また、書面で明示的に記載されている場合を除き、本記事の内容に基づいて行われたいかなる行動についても責任を負いません。
この記事が気に入ったら、著者にチップを送って感謝の気持ちを表しましょう。

