



ByLCMS Traders FX Analysis Team
AUG 11, 2021
GBP/USD Daily Forecast
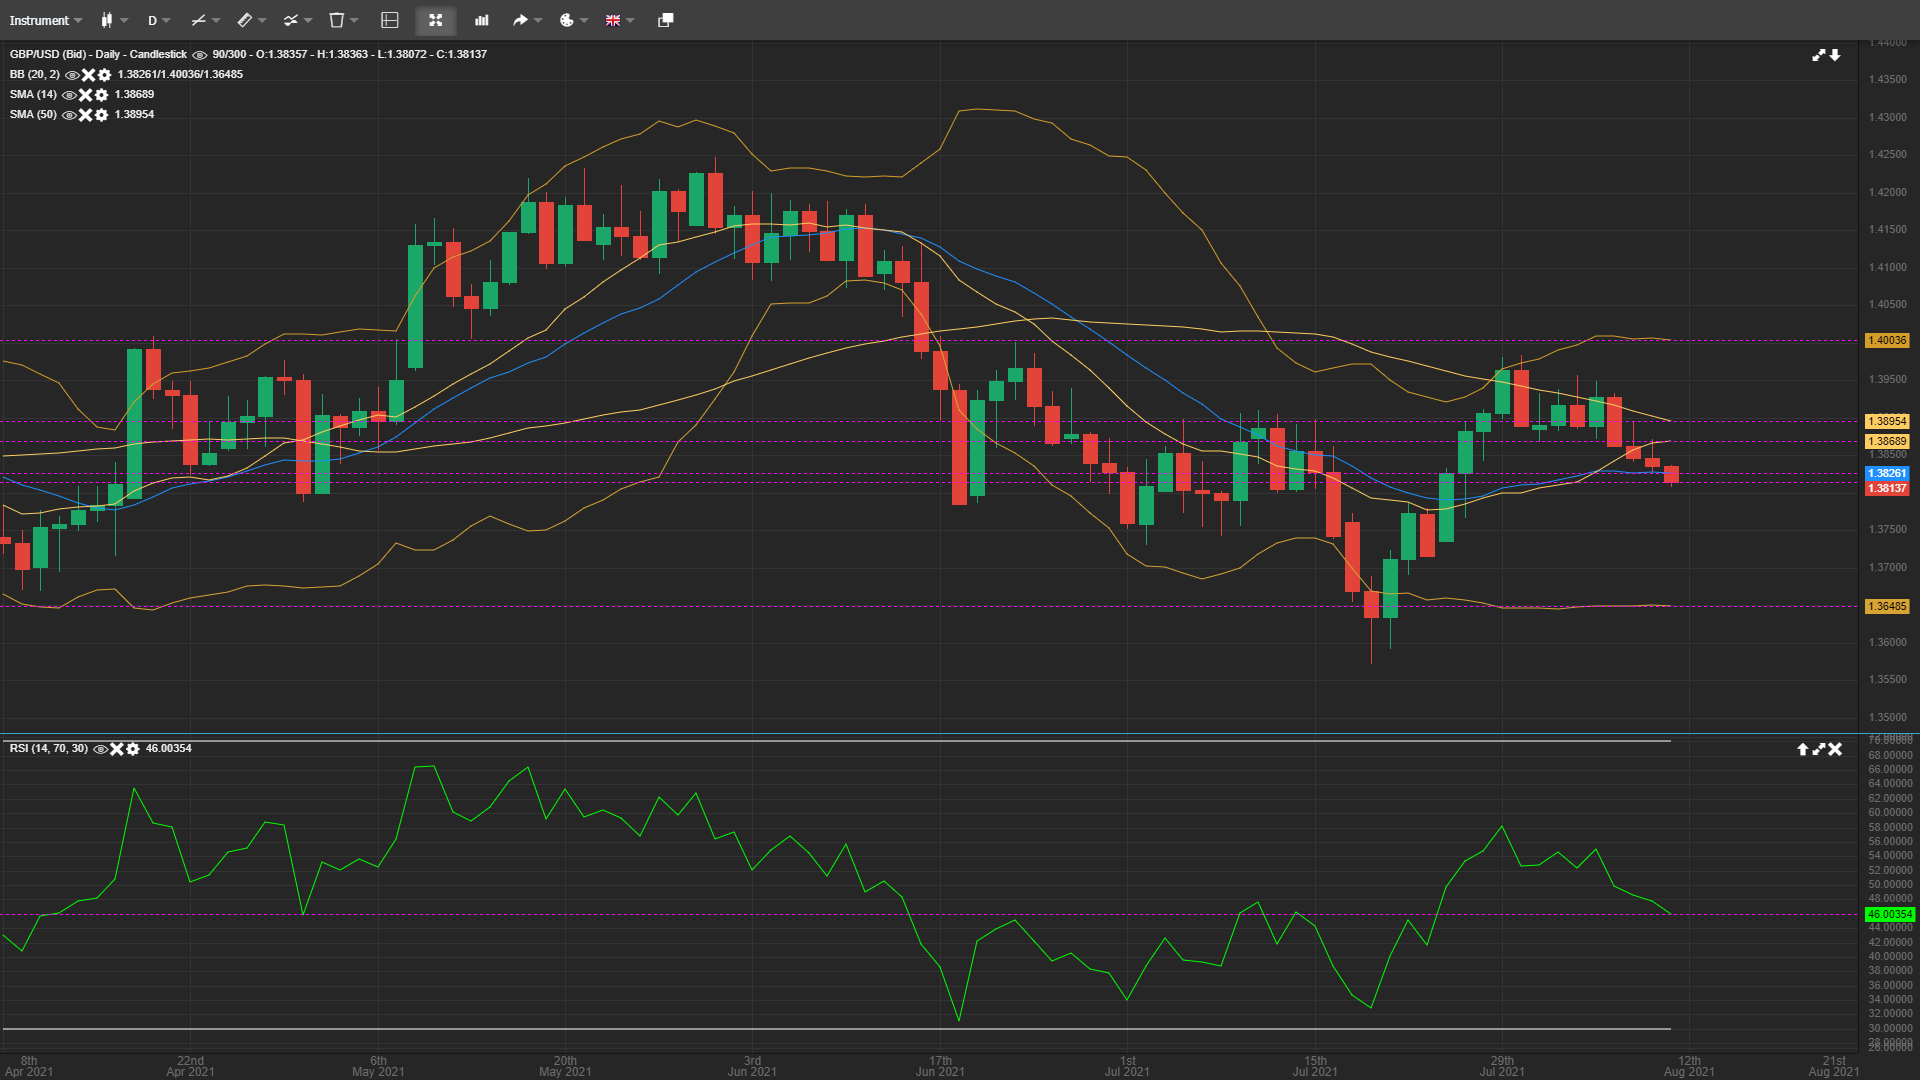
GBP/USD is trading 0.16% lower to 1.3813 and it appears that the bears are likely to extend the downside well below the 1.3800 mark which is acting as a strong support area. Other support areas are at 1.3768 and 1.3733. The intraday resistance levels are at 1.3849 and 1.3872.
On the intraday charts, the price pattern is now strongly bearish. The SMA-14 is indicating resistance at 1.3868 and the SMA-50 resistance line is at 1.3895. The RSI is at 46 and has a downwards curve while the MACD is below the middle line and indicating a further bearish trajectory. The mid-Bollinger band is at 1.3826 and the upper and lower bands are at 1.4003 and 1.3648 respectively. Following the intraday and 4-hourly price pattern the pair is ideal to sell on small rallies using the following levels
Direction: Sell
Entry: 1.3835
Take Profit: 1.3790 – 1.3765
Stop-Loss: 1.3875
免責事項:本記事で述べられている見解は著者の見解のみであり、Followmeの公式見解を反映するものではありません。Followmeは、提供された情報の正確性、完全性、信頼性について一切責任を負いません。また、書面で明示的に記載されている場合を除き、本記事の内容に基づいて行われたいかなる行動についても責任を負いません。

