


In this article we will go through the best crypto technical analysis app andc software tools.
We list which technical software and tools you need to start your journey and what platforms offer these technical analysis features for free. Topics that will be covered are:
What is Crypto Technical Analysis?
Crypto Technical Analysis Charts
Crypto Technical Analysis Indicators
Crypto Technical Analysis Time Intervals
Crypto Technical Analysis Drawing Tools
Best Trading platform for Crypto Technical Analysis
We go through there aspects since we believe that a crypto technical analysis software must cover all these bullets above. There are other software related to crypto trading, such as, crypto trading bots and crypto tax software that is handled in other articles.
In the end of the day, there is really no competitor to Tradingview in terms of being the best crypto technical analysis software.
The best part is that almost all top Bitcoin trading sites have Tradingview integrated in their platforms. You will get all benefits in the charts but you cant get access to all features on the Tradingview premium software.
What is Crypto Technical Analysis ?
Crypto technical analysis can be done with different software. The software is used to help traders to identify price trends. It helps them figure out how the market behaves, providing a sound basis for smart trading choices.
Although it may sound complicated, it is nothing more than analyzing the demand and supply in the desired market.
Technical analysts look to identify patterns in the price change throughout history. Based on the existing statistics, investors make an assumption on the future price and come up with a trading decision.
Chart investigation is a crucial part of any crypto technical analysis. You can identify trends by keeping track of moving averages, support and resistance levels, and trading volume.
Crypto technical analysis is usually useful for short term trading, such as, day trading and similar crypto trading strategies.
There are two main types of tech analysis that every crypto trader should employ on a daily basis. Their concepts are quite simple but the implementation is what differs successful investors from others.
– Short-term technical investigation (the period in between a day and a week, with emphasis on small price changes and patterns. You, as a trader, are trying to find peaks and bottoms that may occur within the next hour.)
– Long-term technical investigation (ranging between a month and a year. This is used for a general course of a chosen crypto and whether it should be in your portfolio long-term.)
Crypto Technical Analysis Charts
Bars - Crypto Technical Analysis
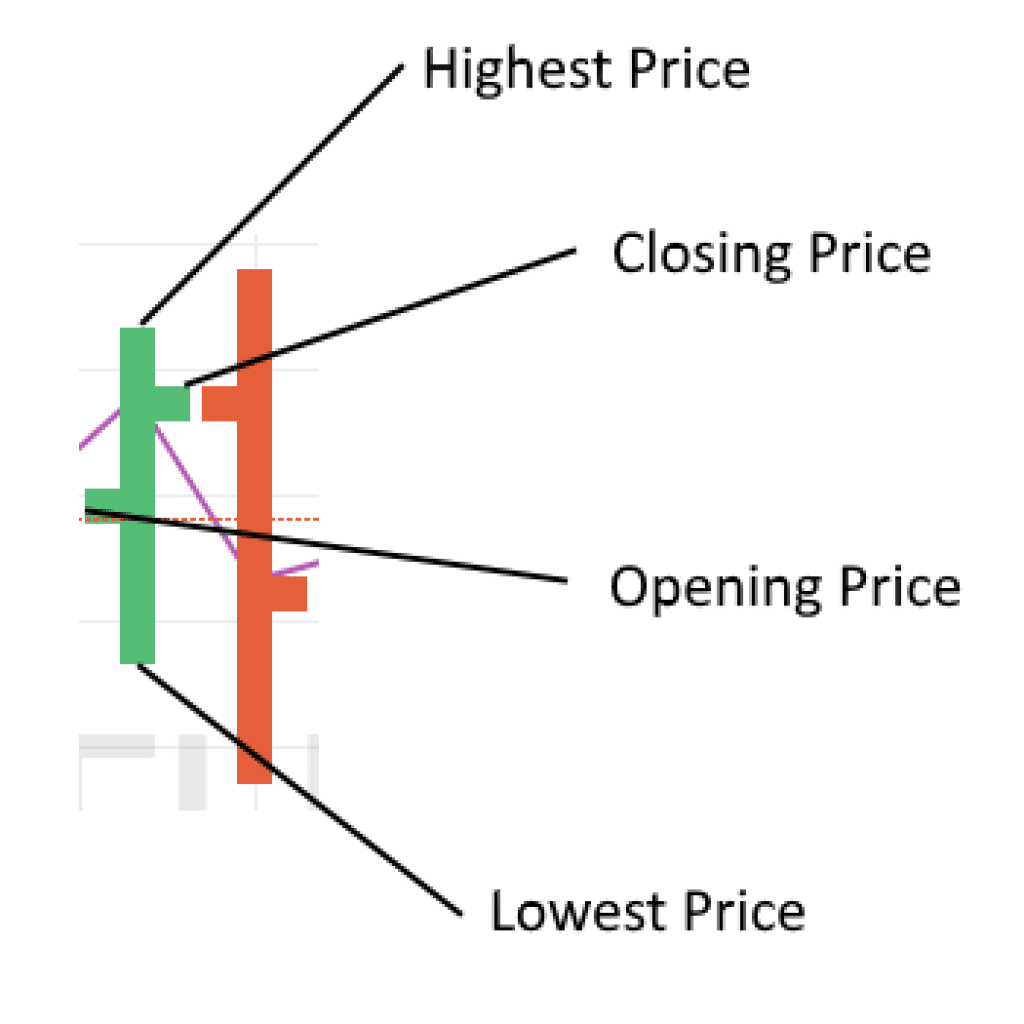
A basic tool for technical analysis is the bar chart. From one bar in the chart you will get information regarding open price, close price, highest price and lowest price within the selected time frame represented by the bar.
Candlesticks - Crypto Technical Analysis
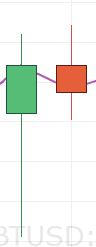
Candlesticks are the most common graph type in technical analysis. The purpose of candlesticks is to identify trends and trend lines. Candlesticks contains the same information as the bars but looks different graphically.
Crypto Technical Analysis Indicators
Technical indicators are a critical tool for making decisions based on crypto technical analysis. Indicators are mathematical formulas calculated based on historic parameters of the underlying asset. These are some of the most common technical indicators:
Moving Average (MA)
Moving average is one of the most common technical indicators. You calculate this over a certain time period. If you are looking for the 30-day moving average you sum the last 30-days closing price and divide it by 30.
Moving Averages Convergence Divergence (MACD)
This is a trend-following momentum indicator. It is calculated as a relationship between two moving averages. MACD is calculated by subtracting the 26-period Exponential Moving Average (EMA) from the 12-period EMA.
Relative Strength Index (RSI)
This technical indicator is a momentum indicator to evaluate if the underlying asset is overbought or oversold. Relative strength index measures the magnitude of recent price changes and is displayed as an oscillator that can have a reading from 0 to 100. An oscillator is a graph that moves between two extremes.
On-Balance Volume (OBV)
This is a technical trading momentum indicator that uses volume flow to predict changes for a cryptocurrency.
免責事項:本記事で述べられている見解は著者の見解のみであり、Followmeの公式見解を反映するものではありません。Followmeは、提供された情報の正確性、完全性、信頼性について一切責任を負いません。また、書面で明示的に記載されている場合を除き、本記事の内容に基づいて行われたいかなる行動についても責任を負いません。

