· Views 258
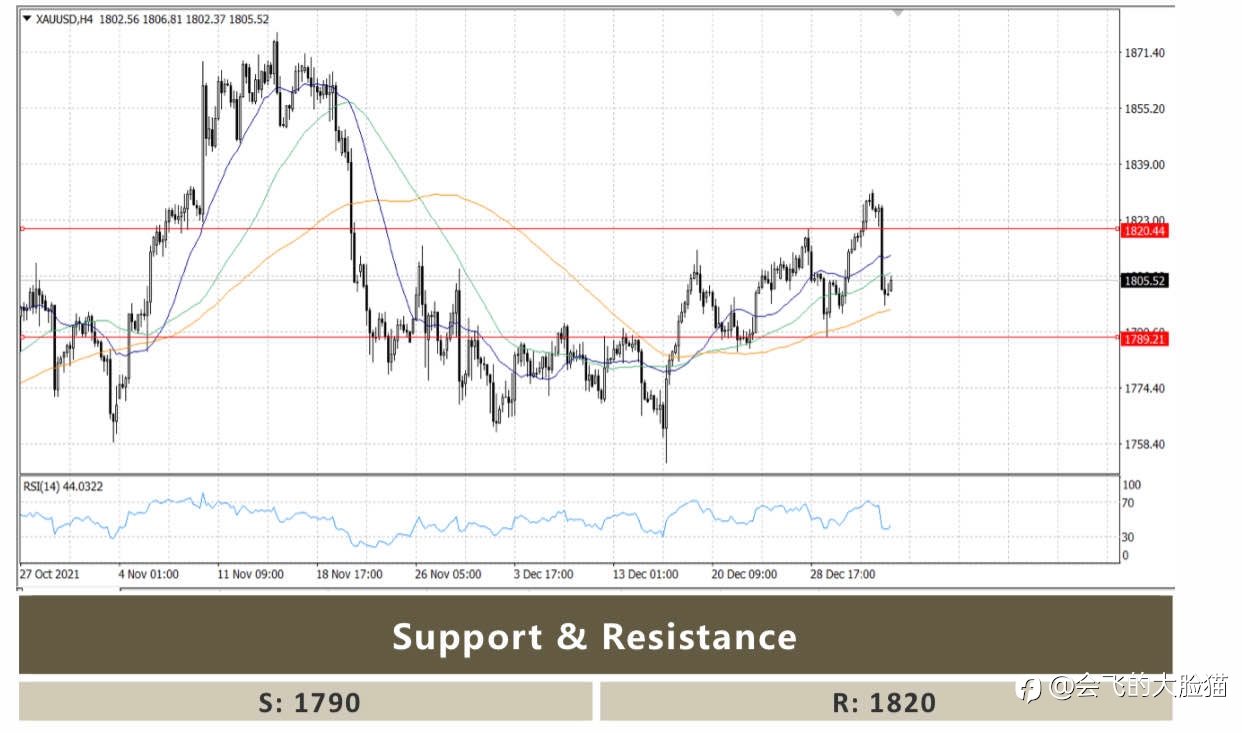
#XAU/USD# The 4-hour chart shows that the price has fallen below its 20 and 200 SMAs, while approaching a mildly bullish 100 SMA, reflecting sellers’ strength. Meanwhile, the Momentum indicator is crossing its midline into negative territory, while the RSI indicator heads lower at around 44, all of which hints at a bearish continuation, particularly on a break below $1,790, the immediate support level. #gold#
免責事項:本記事で述べられている見解は著者の見解のみであり、Followmeの公式見解を反映するものではありません。Followmeは、提供された情報の正確性、完全性、信頼性について一切責任を負いません。また、書面で明示的に記載されている場合を除き、本記事の内容に基づいて行われたいかなる行動についても責任を負いません。
この記事が気に入ったら、著者にチップを送って感謝の気持ちを表しましょう。

