


· Views 278
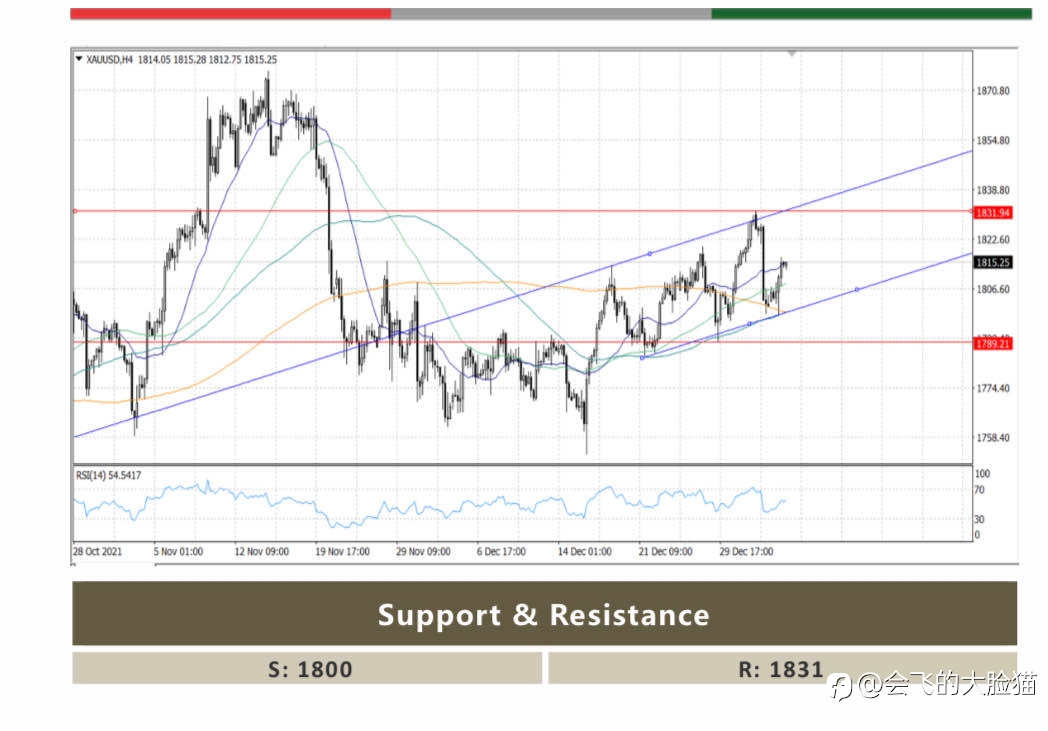
The 4-hour chart shows that gold is trading between its 100 SMA, providing support around the daily low, and a bullish 20 SMA capping the upside. Technical indicators, in the meantime, remain directionless within neutral levels. The resistance is near the monthly top $1,831. However, the support is aligned with the lower support band $1,800 #gold# #trading#
免責事項:本記事で述べられている見解は著者の見解のみであり、Followmeの公式見解を反映するものではありません。Followmeは、提供された情報の正確性、完全性、信頼性について一切責任を負いません。また、書面で明示的に記載されている場合を除き、本記事の内容に基づいて行われたいかなる行動についても責任を負いません。
この記事が気に入ったら、著者にチップを送って感謝の気持ちを表しましょう。

