


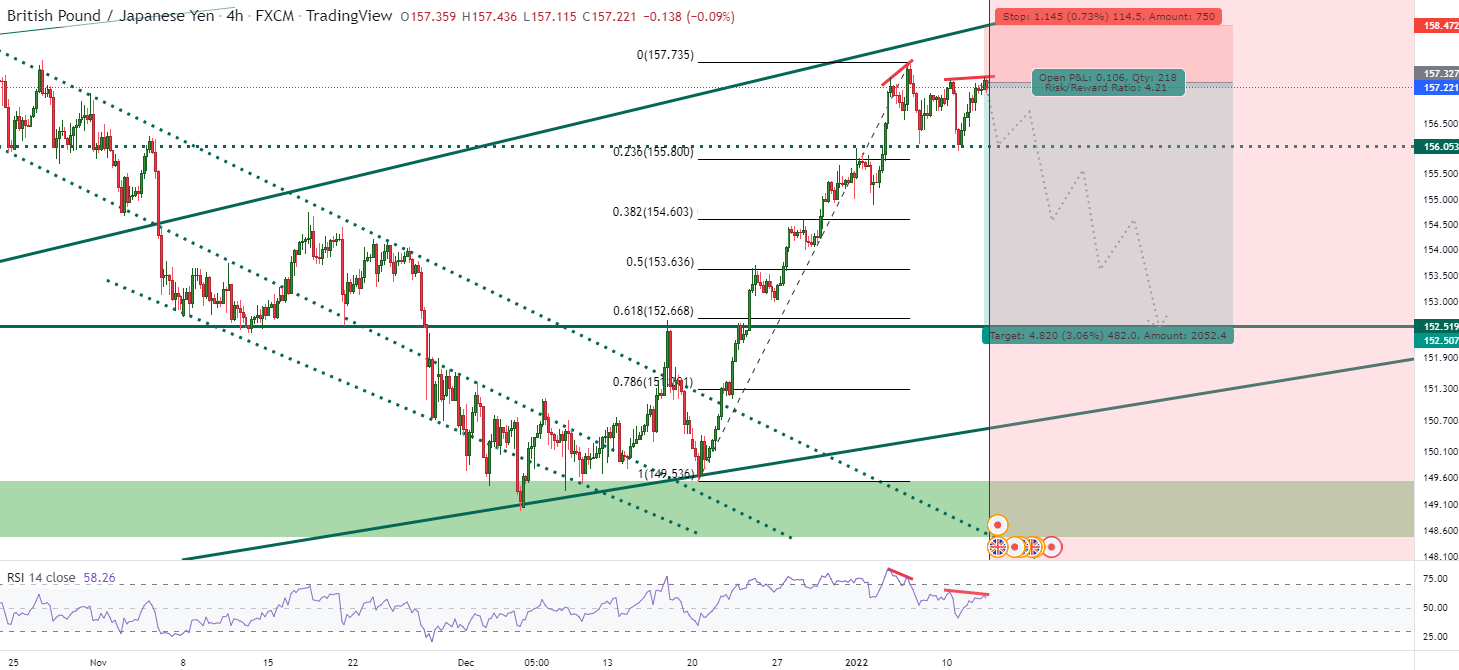
Technical: RSI Divergence in 4H chart generally brings pattern reversal in GJ. I have seen it many times before. Specially if two or more divergence happen for few times in the same price zone. There was a failed H&S also which means after forming the H&S the big players tried to take the direction in opposite way to fake it out and now they are accumulating their short position. It may test 157.76 area (the high created few days back) and also may test Oct high (158.20). So I am going to put my SL few pips above that (158.47)
Fundamental: Interest rate and other fundamental data was really good for GBP which drove the price to 149.53 to 157.63 in just 2 weeks time. Now as US is going to raise the interest rate and also will take hard measures to control inflation so it will added extra pressure on GBP and big investors generally take their position slowly much earlier than the actual decision come. So they are trying to fake out in the Long direction and then ultimately crush the price. It looks like JPY is really powerless at this moment so for this pair at this moment price movement is fully controlled by GBP.
This is not financial advice. Do your analysis before entering any position.
免責事項:本記事で述べられている見解は著者の見解のみであり、Followmeの公式見解を反映するものではありません。Followmeは、提供された情報の正確性、完全性、信頼性について一切責任を負いません。また、書面で明示的に記載されている場合を除き、本記事の内容に基づいて行われたいかなる行動についても責任を負いません。

