


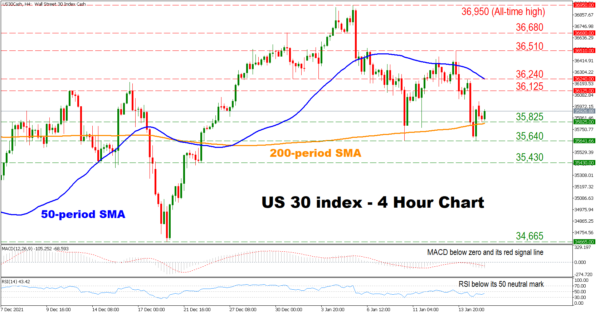
The US 30 index has retreated from its all-time high in early January amid strengthening negative momentum. Moreover, the index has crossed below the 50-period simple moving average (SMA), which is considered as a bearish sign for the near term.
Short-term momentum indicators are also reflecting a negative bias for the index, as the RSI is located below its 50 neutral mark. The MACD is found below zero and below its red signal line, indicating that negative momentum might be gaining further ground.
Should the bears remain in charge, initial support might be found at the region which includes the 35,825 level and the 200-period SMA currently at 35,800. A break below that area could pressure the price towards the 35,640 obstacle, before sellers eye the 35,430 hurdle. Crossing below the latter, could increase selling pressures, opening the door towards the 34,665 barrier.
On the flip side, if the bulls retake control, the first target might be the 36,125 resistance before shifting their attention towards the area which includes the 50-period SMA and the 36,240 level. A decisive move above the latter could restore positivity for the index, paving the way towards the 36,510 point. Surpassing this obstacle, the price could then test the 36,680 barrier before sellers shift their attention towards the all-time high at 36,950.
In brief, the short-term outlook for the index is cautiously bearish. For sentiment to change, buyers would need to drive the price above the 50-period SMA.
免責事項:本記事で述べられている見解は著者の見解のみであり、Followmeの公式見解を反映するものではありません。Followmeは、提供された情報の正確性、完全性、信頼性について一切責任を負いません。また、書面で明示的に記載されている場合を除き、本記事の内容に基づいて行われたいかなる行動についても責任を負いません。

