


Key Highlights
- EUR/USD failed near 1.1495 and started a downside correction.
- It traded below a key bullish trend line with support near 1.1385 on the 4-hours chart.
- GBP/USD is still struggling to clear the key 1.3600 resistance.
- Gold price extended rally above the $1,850 resistance.
EUR/USD Technical Analysis
The Euro made another attempt to clear the 1.1500 zone against the US Dollar. However, EUR/USD failed to gain pace and formed a short-term high near 1.1494.
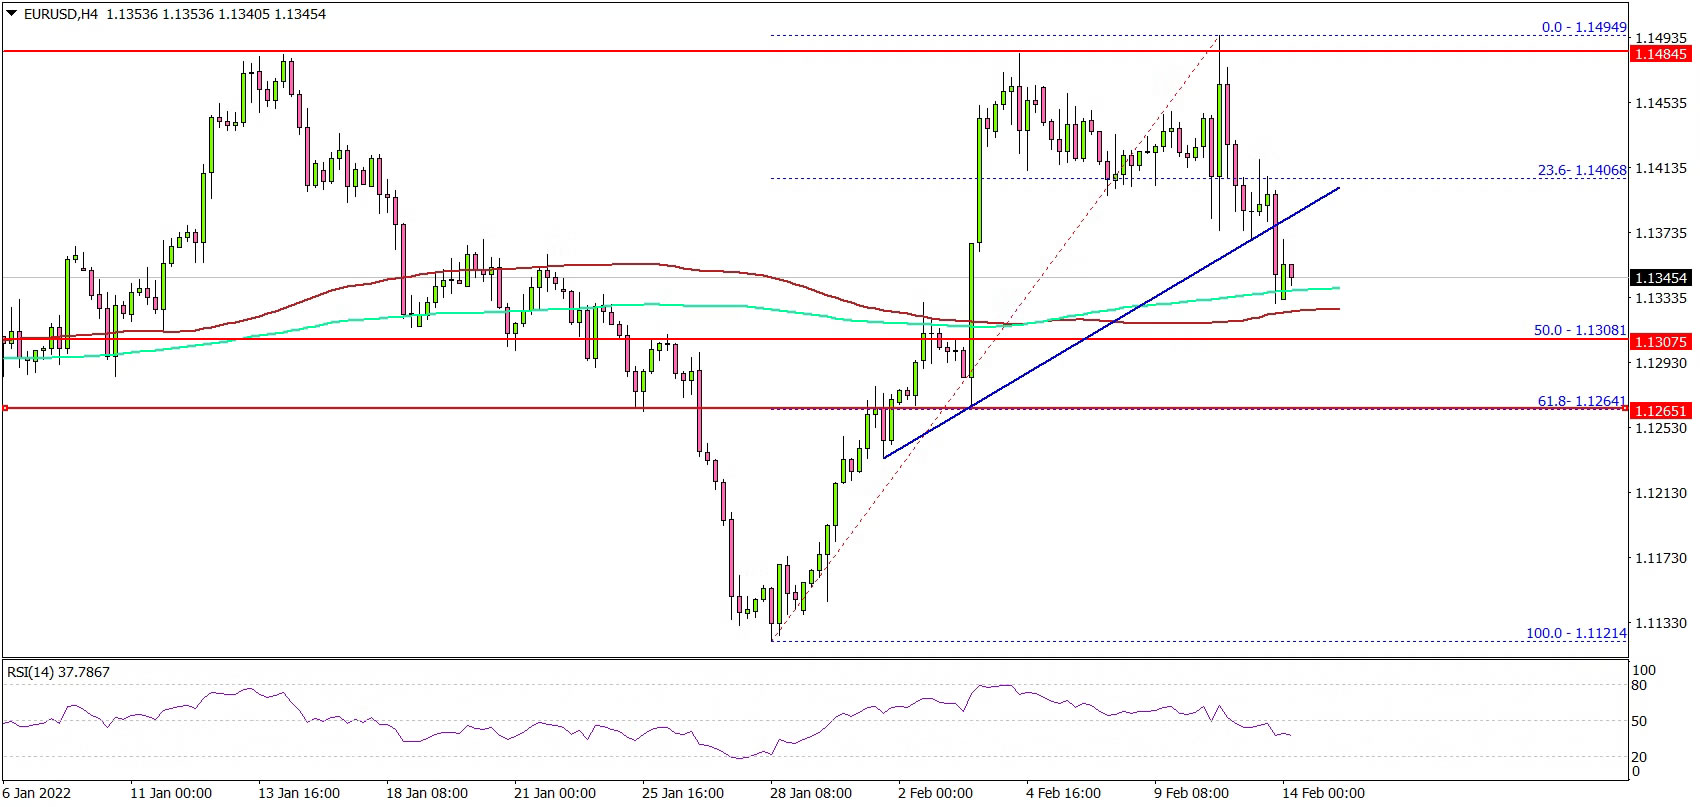
Looking at the 4-hours chart, the pair started a downside correction below the 1.1450 level. The pair spiked below the 38.2% Fib retracement level of the upward move from the 1.1124 swing low to 1.1494 high.
Besides, there was a break below a key bullish trend line with support near 1.1385 on the same chart. It tested the 100 simple moving average (red, 4-hours) and the 200 simple moving average (green, 4-hours).
The next major support is near the 1.1310 level. It is near the 50% Fib retracement level of the upward move from the 1.1124 swing low to 1.1494 high.
Any more losses could push EUR/USD towards the 1.1250 support. On the upside, the pair might face sellers near the 1.1400 level. The main breakout resistance is still near the 1.1480 and 1.1500 levels.
Looking at GBP/USD, the pair is still struggling to clear the 1.3600 resistance level. Conversely, gold price and crude oil price saw a major increase above $1,850 and $92.00 respectively.
Economic Releases
Swiss PPI for Jan 2022 (YoY) – Forecast +5.6%, versus +5.1% previous.
免責事項:本記事で述べられている見解は著者の見解のみであり、Followmeの公式見解を反映するものではありません。Followmeは、提供された情報の正確性、完全性、信頼性について一切責任を負いません。また、書面で明示的に記載されている場合を除き、本記事の内容に基づいて行われたいかなる行動についても責任を負いません。

