


WEEKLY TECHNICAL OUTLOOK ON S&P500
SPX500 was, “attempting to break below key support into the close of the week at 4364/72- a region defined by the 61.8% Fibonacci retracement of the late-January recovery and the 52-week moving average.Weakness beyond this level threatens a new yearly low for the index with initial support seen at the 23.6% retracement of the entire 2019 rally at 4197- look for a larger reaction there IF reached.” SPX plunged lower the following week with the index briefly registering a low at 4104 before reversing sharply off a sliding parallel extending off the 2019 lows.
The rebound failed this week back a the 52-week moving average, putting initial resistance at 4392- a breach / close above this threshold is needed to shift the near-term focus higher towards the 61.8% Fibonacci retracement of 2022 range at 4547. Broader bearish invalidation steady at the yearly high-week close at 4677. Weekly support unchanged at 4197 backed by the 2019 trendline- a daily break / close below this slope would threaten another bout of accelerated losses towards key support at the May lows/ 100% extension of the yearly decline at 3993-4035.
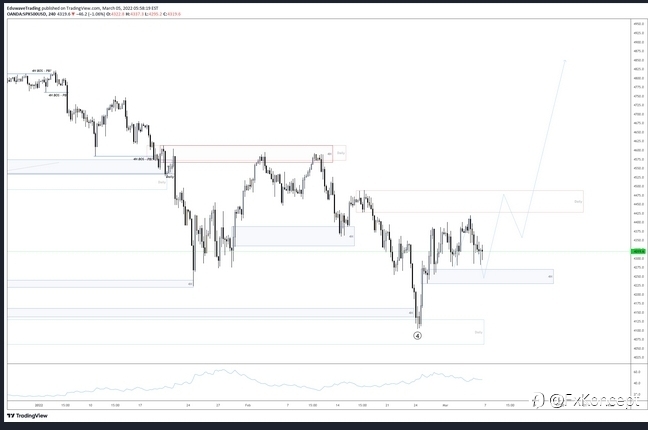
SXP500 WEEKLY CHART VIEW
免責事項:本記事で述べられている見解は著者の見解のみであり、Followmeの公式見解を反映するものではありません。Followmeは、提供された情報の正確性、完全性、信頼性について一切責任を負いません。また、書面で明示的に記載されている場合を除き、本記事の内容に基づいて行われたいかなる行動についても責任を負いません。

