


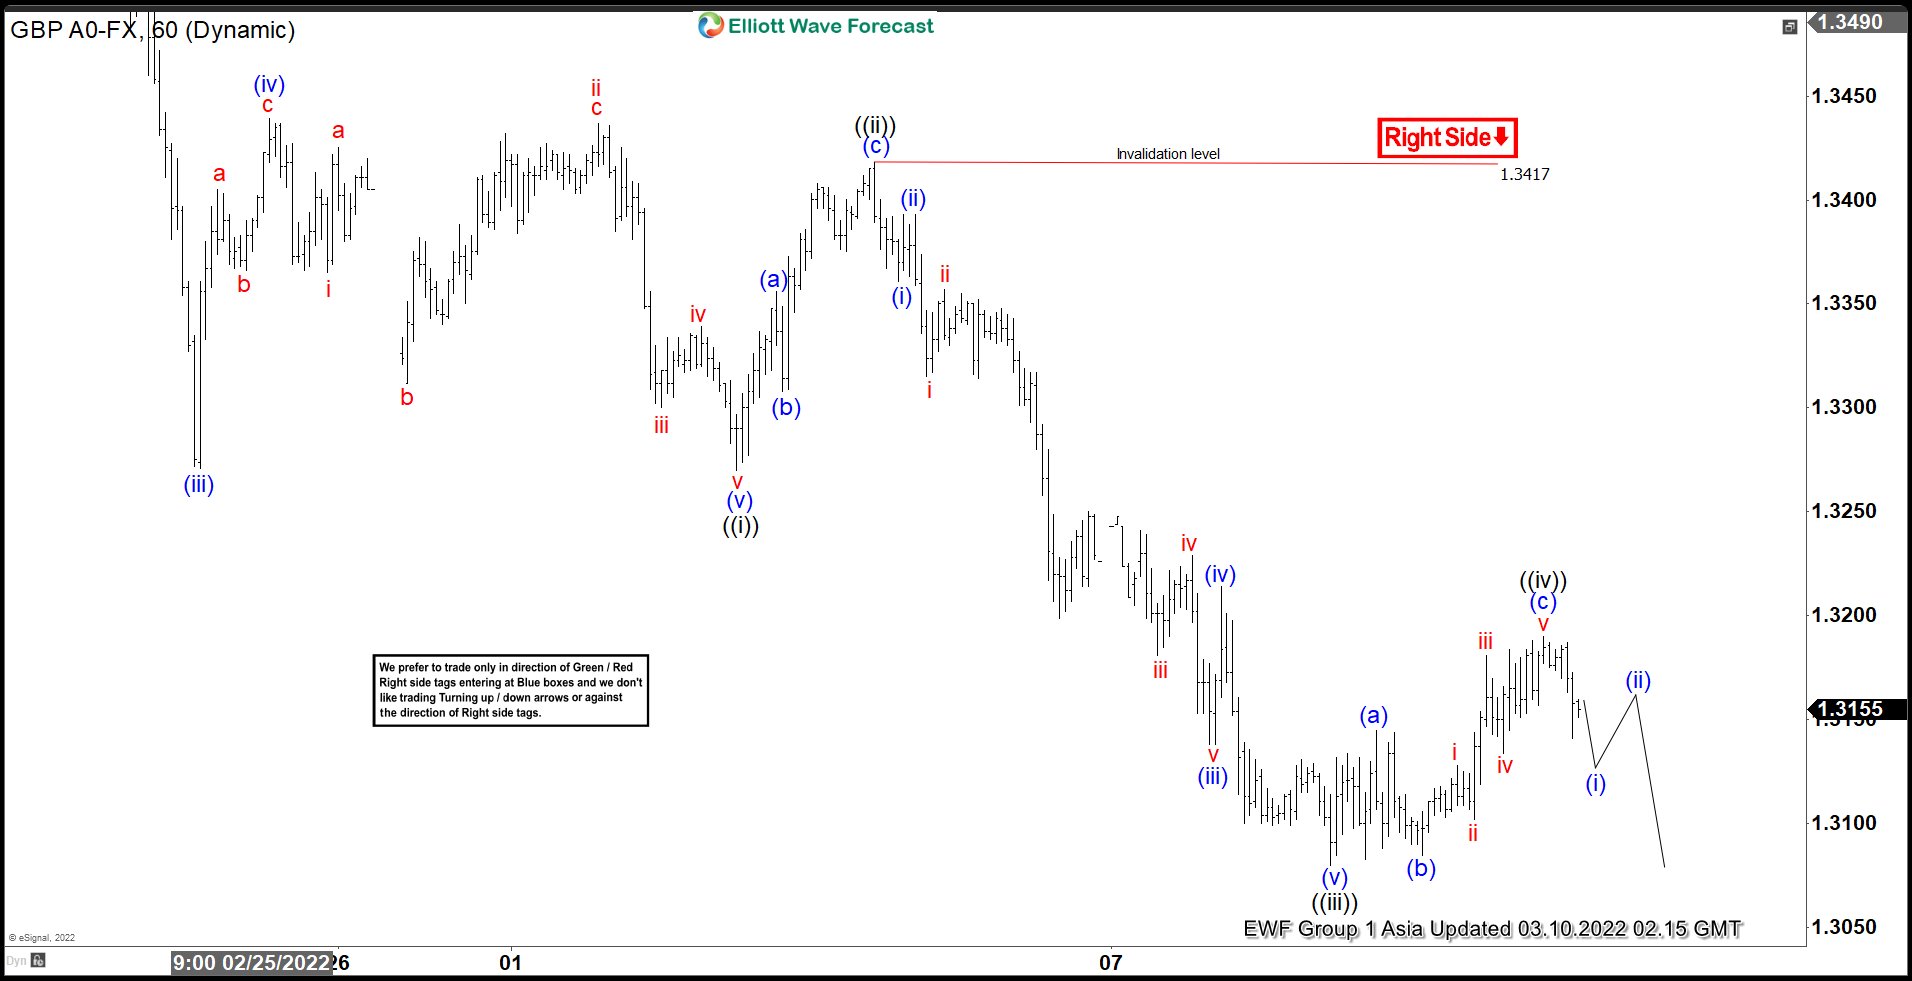
Short Term Elliott Wave View in GBPUSD suggests that the decline from February 18 peak is unfolding as a 5 waves impulse Elliott Wave structure. Down from February 18, wave (i) ended at 1.3536, and rally in wave (ii) ended at 1.3621. Pair then resumes lower in wave (iii) towards 1.3272, and rally in wave (iv) ended at 1.3439. Final leg lower wave (v) ended at 1.327 which also completed wave ((i)). Rally in wave ((ii)) completed at 1.3417 with internal subdivision as a zigzag. Up from wave ((i)), wave (a) ended at 1.335, pullback in wave (b) ended at 1.3308, and wave (c) higher ended at 1.3417 which completed wave ((ii)).
Pair resumes lower in wave ((iii)) with internal subdivision as an impulse. Down from wave ((ii)), wave (i) ended at 1.336, and wave (ii) ended at 1.3393. Pair resumes lower in wave (iii) which ended at 1.3138, and wave (iv) rally ended at 1.3214. Final leg lower wave (v) of ((iii)) ended at 1.3080. Wave ((iv)) rally in GBPUSD ended at 1.3190 with internal subdivision as a flat Elliott Wave structure. Near term, expect pair to extend lower in wave ((v)). As far as pivot at 1.3417 high stays intact, rally should fail in the sequence of 3, 7, or 11 swing for further downside.
GBPUSD 60 Minutes Elliott Wave Chart
免責事項:本記事で述べられている見解は著者の見解のみであり、Followmeの公式見解を反映するものではありません。Followmeは、提供された情報の正確性、完全性、信頼性について一切責任を負いません。また、書面で明示的に記載されている場合を除き、本記事の内容に基づいて行われたいかなる行動についても責任を負いません。

