


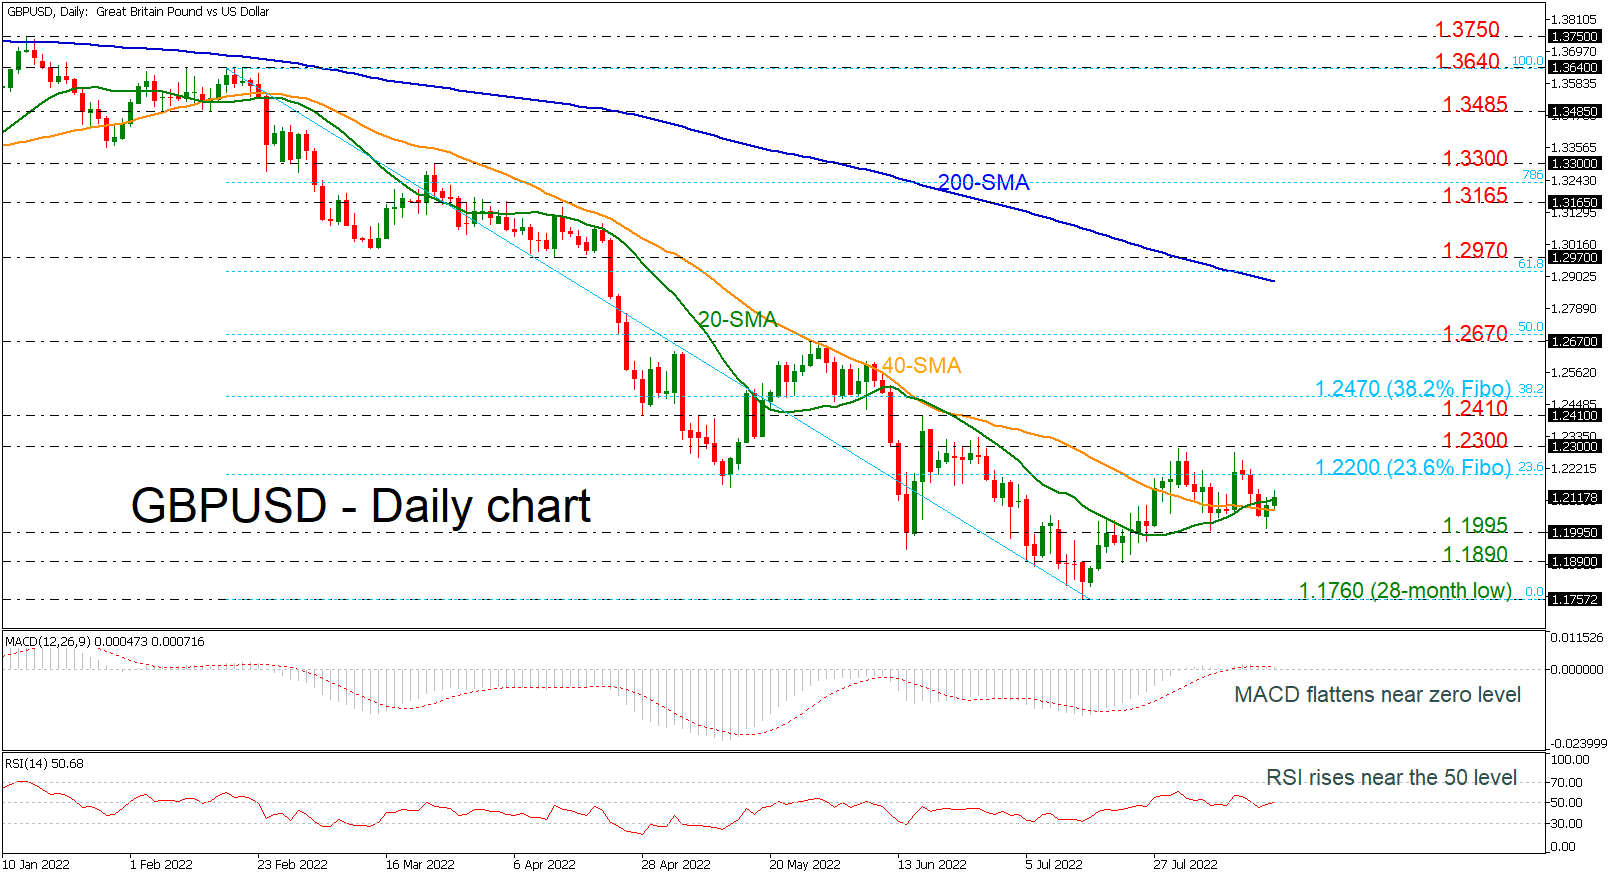
GBPUSD rebounded off the 1.2000 psychological level in the preceding session, flirting with the 20- and 40-day simple moving averages (SMAs). The bullish crossover within the SMAs remains intact, suggesting that a bullish correction may be on the radar in the short-term timeframe. The MACD oscillator is moving sideways near its trigger and zero lines, while the RSI is approaching the neutral threshold of 50.
If the market manages to gain momentum, the 23.6% Fibonacci retracement level of the decline from 1.3640 to 1.1760 at 1.2200 may act as nearby resistance ahead of the 1.2300 barrier. A sustained close above the latter may pave the way for 1.2410 and the 38.2% Fibonacci level at 1.2470.
On the other hand, a move lower again may find next support at 1.1995, a level that has acted as both resistance and support throughout the month of July and the beginning of August. When that level is broken, the next potential support is at 1.1890, after which the attention can turn to the 28-month low at 1.1760.
Since prices are still below the 1.2200 resistance, the medium-term picture is unfavorable and only a successful climb above the 200-day SMA may switch the outlook to bullish.
免責事項:本記事で述べられている見解は著者の見解のみであり、Followmeの公式見解を反映するものではありません。Followmeは、提供された情報の正確性、完全性、信頼性について一切責任を負いません。また、書面で明示的に記載されている場合を除き、本記事の内容に基づいて行われたいかなる行動についても責任を負いません。

