


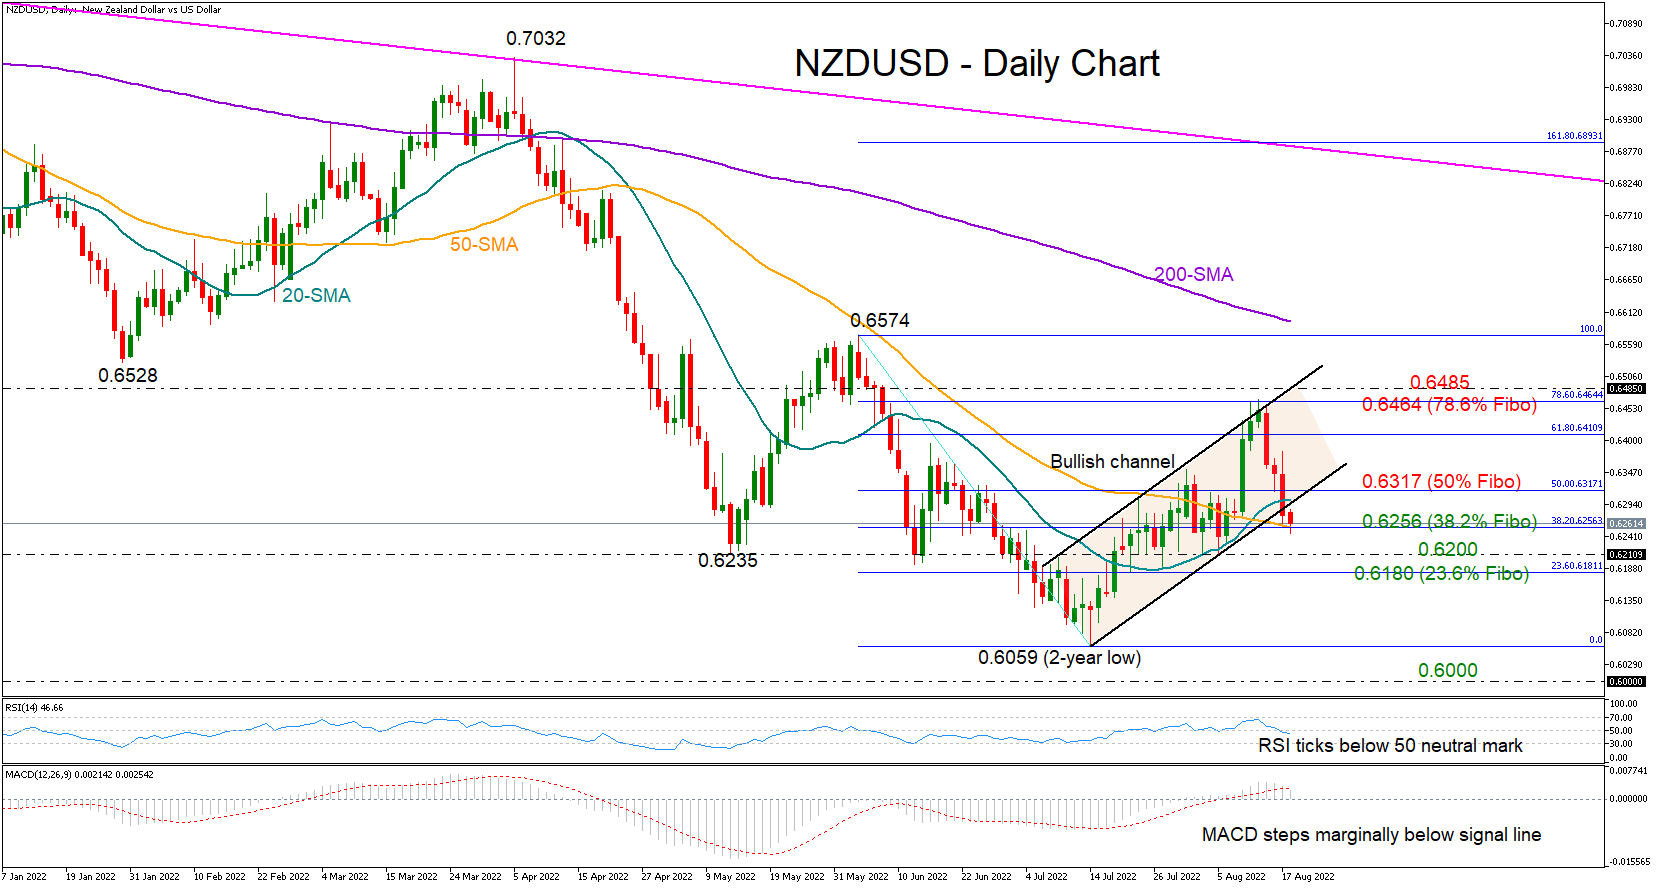
NZDUSD is in the fourth consecutive day of declines, set to confirm its exit from a short-term bullish channel at 0.6267.
While the momentum indicators suggest that the negative correction has just started, some confirmation is required since the RSI and the MACD have not significantly deviated below their neutral levels; the RSI is still close to its 50 neutral mark and the MACD marginally below its red signal line, reflecting a neutral-to-bearish short-term bias overall.
Moreover, the price itself is currently facing support around the 50-day simple moving average (SMA) and the 38.2% Fibonacci retracement of the 0.6574 – 0.6059 downfall at 0.6256. If that base holds, with the price immediately crawling back above the 50% Fibonacci of 0.6317, the bulls may again attempt to breach the 78.6% Fibonacci of 0.6464 and the channel’s upper boundary seen at 0.6485. Should they claim this zone, all attention will turn to June’s peak of 0.6574. Note that the 200-day SMA is also converging to that number.
In the event the sell-off continues, the focus will initially turn to the 0.6200 – 0.6180 region. Another defeat at this point could aggressively press the pair towards the two-year low of 0.6059, while lower, the price may chart a new lower low at 0.6000.
Summarizing, despite the quick depreciation in NZDUSD, the pair might have another opportunity to improve its fortunes at 0.6256. Otherwise, the bearish wave could gain extra legs.
免責事項:本記事で述べられている見解は著者の見解のみであり、Followmeの公式見解を反映するものではありません。Followmeは、提供された情報の正確性、完全性、信頼性について一切責任を負いません。また、書面で明示的に記載されている場合を除き、本記事の内容に基づいて行われたいかなる行動についても責任を負いません。

