


· Views 1,237
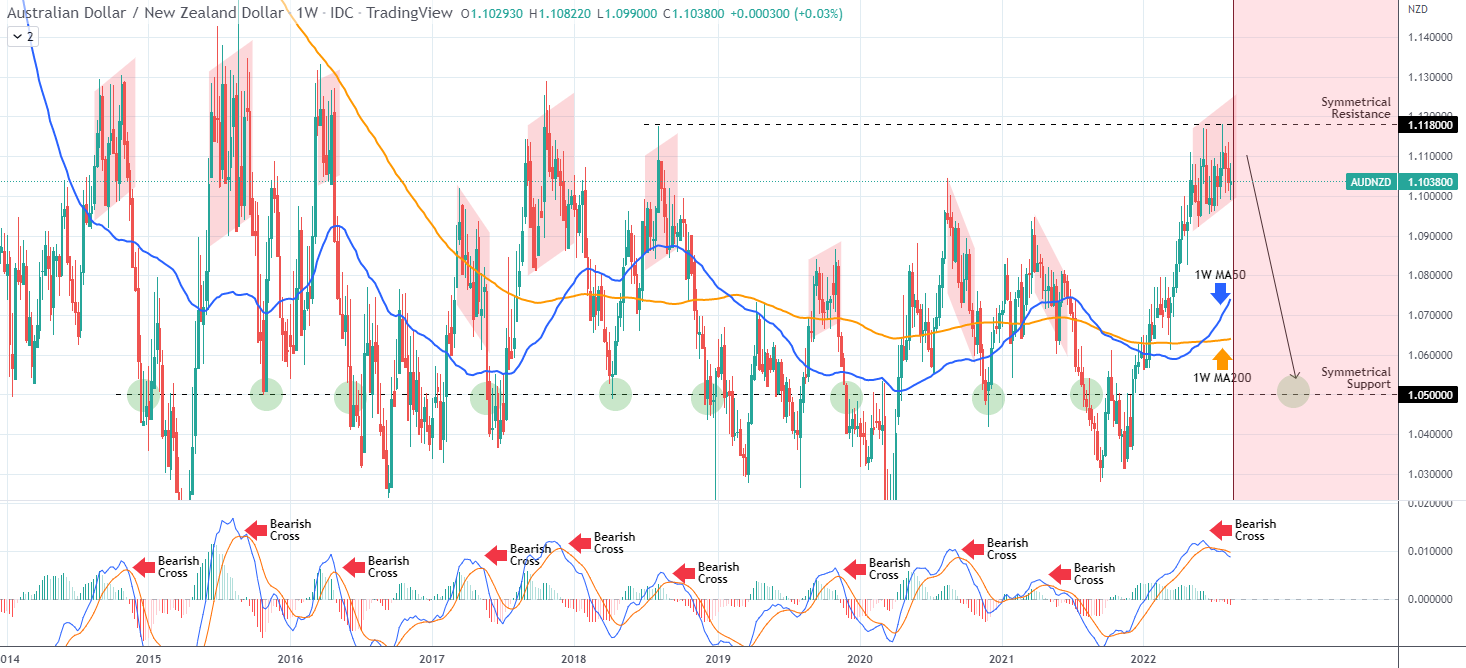
The AUDNZD pair is trading within a Channel Up since the start of May but has most likely peaked based on this unique pattern going back 8 years.
The chart is on the 1W time-frame where the MACD is trading downwards after a late June Bearish Cross. As you see, every such Bearish Cross above the 0.0 MACD level, formed a long-term Top on either a Channel Up or Down pattern since 2014. All the downtrends that followed this peak formation were sharp sell-offs that dropped to at least the 1.0500 level (symmetrical Support) even though most reached a lot lower.
As a result since we are still inside the Channel Up pattern, this could be the best place for a sell position this year. You can use three target levels: the 1W MA50 (blue trend-line) short-term, the 1W MA200 (orange trend-line) medium-term and the 1.0500 Symmetrical Support for the long-term. #OPINIONLEADER#
免責事項:本記事で述べられている見解は著者の見解のみであり、Followmeの公式見解を反映するものではありません。Followmeは、提供された情報の正確性、完全性、信頼性について一切責任を負いません。また、書面で明示的に記載されている場合を除き、本記事の内容に基づいて行われたいかなる行動についても責任を負いません。
この記事が気に入ったら、著者にチップを送って感謝の気持ちを表しましょう。

