| Scenario | |
|---|---|
| Timeframe | Weekly |
| Recommendation | SELL STOP |
| Entry Point | 31.20 |
| Take Profit | 28.12 |
| Stop Loss | 33.40 |
| Key Levels | 28.12, 31.25, 34.38, 37.50, 40.62 |
| Alternative scenario | |
|---|---|
| Recommendation | BUY STOP |
| Entry Point | 34.38 |
| Take Profit | 37.50, 40.62 |
| Stop Loss | 32.20 |
| Key Levels | 28.12, 31.25, 34.38, 37.50, 40.62 |
Current trend
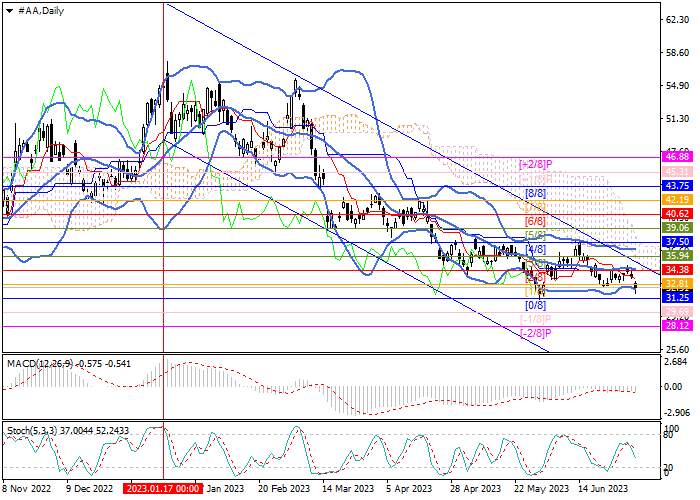
The stocks of one of the world's largest aluminum producers Alcoa Corp. continue to trade within the long-term descending channel.
Currently, the price is close to the lower limit of the main Murray trading range at 31.25 (Murray level [0/8]), its breakdown will allow it to continue moving to the reversal zone to the level of 28.12 (Murray level [-2/8]). The key for the "bulls" is the reversal level of 34.38 (Murray level [2/8]), supported by the middle line of the Bollinger Bands, if consolidated above it, the price will be able to leave the descending channel and continue to rise to 37.50 (Murray level [4/8]) and 40.62 (Murray level [6/8]) with a transition to the positive part of the trading range.
Technical indicators allow for further decline: the Bollinger Bands are horizontal, the Stochastic reverses downwards, the MACD histogram is stable in the negative zone.
Support and resistance
Resistance levels: 34.38, 37.50, 40.62.
Support levels: 31.25, 28.12.

Trading tips
Short positions can be opened below 31.25 with a target at 28.12 and stop-loss at around 33.40. Implementation period: 5-7 days.
Long positions can be opened above 34.38 with targets at 37.50, 40.62 and stop-loss at around 32.20.
免責事項:本記事で述べられている見解は著者の見解のみであり、Followmeの公式見解を反映するものではありません。Followmeは、提供された情報の正確性、完全性、信頼性について一切責任を負いません。また、書面で明示的に記載されている場合を除き、本記事の内容に基づいて行われたいかなる行動についても責任を負いません。

古いコメントはありません。ソファをつかむ最初のものになりましょう。