


| Scenario | |
|---|---|
| Timeframe | Weekly |
| Recommendation | BUY STOP |
| Entry Point | 97.30 |
| Take Profit | 100.00, 103.12 |
| Stop Loss | 95.20 |
| Key Levels | 87.50, 90.62, 93.75, 96.88, 100.00, 103.12 |
| Alternative scenario | |
|---|---|
| Recommendation | SELL STOP |
| Entry Point | 93.75 |
| Take Profit | 90.62, 87.50 |
| Stop Loss | 96.00 |
| Key Levels | 87.50, 90.62, 93.75, 96.88, 100.00, 103.12 |
Current trend
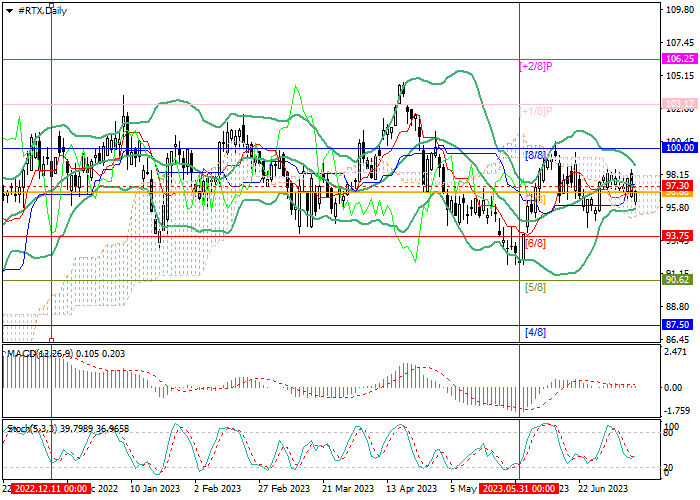
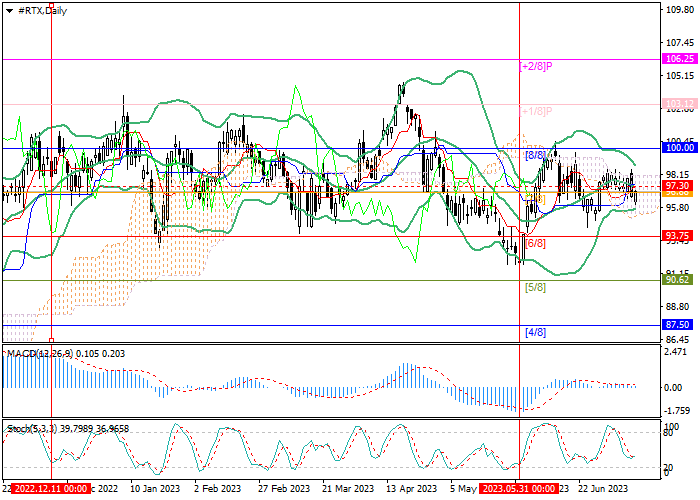
Shares of Raytheon Technologies Corp., an American aerospace and defense conglomerate, have been trading within a wide sideways range since the end of last year from 103.12 (Murrey level [ 1/8]) to 93.75 (Murrey level [6/8]) and cannot yet leave it.
Currently, the price is trying to resume growth and is testing 96.88 (Murrey level [7/8]), consolidation above which and the middle line of Bollinger Bands (97.30) will allow quotes to reach 100.00 (Murrey level [8/8]) and 103.12 (Murrey level [8/8]). Murrey [ 1/8]). The key “bearish” level is the pivot level 93.75 (Murrey’s level [6/8]), which breakdown will provide further decline to 90.62 (Murrey’s level [5/8]) and 87.50 (Murrey’s level [4/8]).
Technical indicators do not give a single signal: Bollinger bands are reversing downwards, Stochastic is trying to reverse upwards, and the MACD histogram is near the zero line, maintaining insignificant volumes.
Support and resistance
Resistance levels: 96.88, 100.00, 103.12.
Support levels: 93.75, 90.62, 87.50.
Trading tips
Long positions may be opened above 97.30 with the targets at 100.00, 103.12 and stop loss around 95.20. Implementation period: 5–7 days.
Short positions may be opened below 93.75 with the targets at 90.62, 87.50 and stop loss around 96.00.
免責事項:本記事で述べられている見解は著者の見解のみであり、Followmeの公式見解を反映するものではありません。Followmeは、提供された情報の正確性、完全性、信頼性について一切責任を負いません。また、書面で明示的に記載されている場合を除き、本記事の内容に基づいて行われたいかなる行動についても責任を負いません。

