


Gold-to-Silver ratio (AUG) overshot to 126.43 during the Covid-19 scare in March 2020. This is an all-time high and arguably unsustainable when measured by many different matrices. The current ratio of 78-79 is still considered to be elevated by historical average. Below are several matrices to measure the proper level of the ratio:
- The pre-1990 average of gold-to-silver ratio is around 16.
- The average throughout the twentieth century is about 65.
- The mining ratio is around 8, which means 8 ounces of Silver for every 1 ounce of Gold mined.
In this article, we will look at the technical outlook of the Gold-to-Silver ratio using Elliott Wave as the chart below shows.
Gold-to-Silver (AUG) Daily Elliott Wave Chart
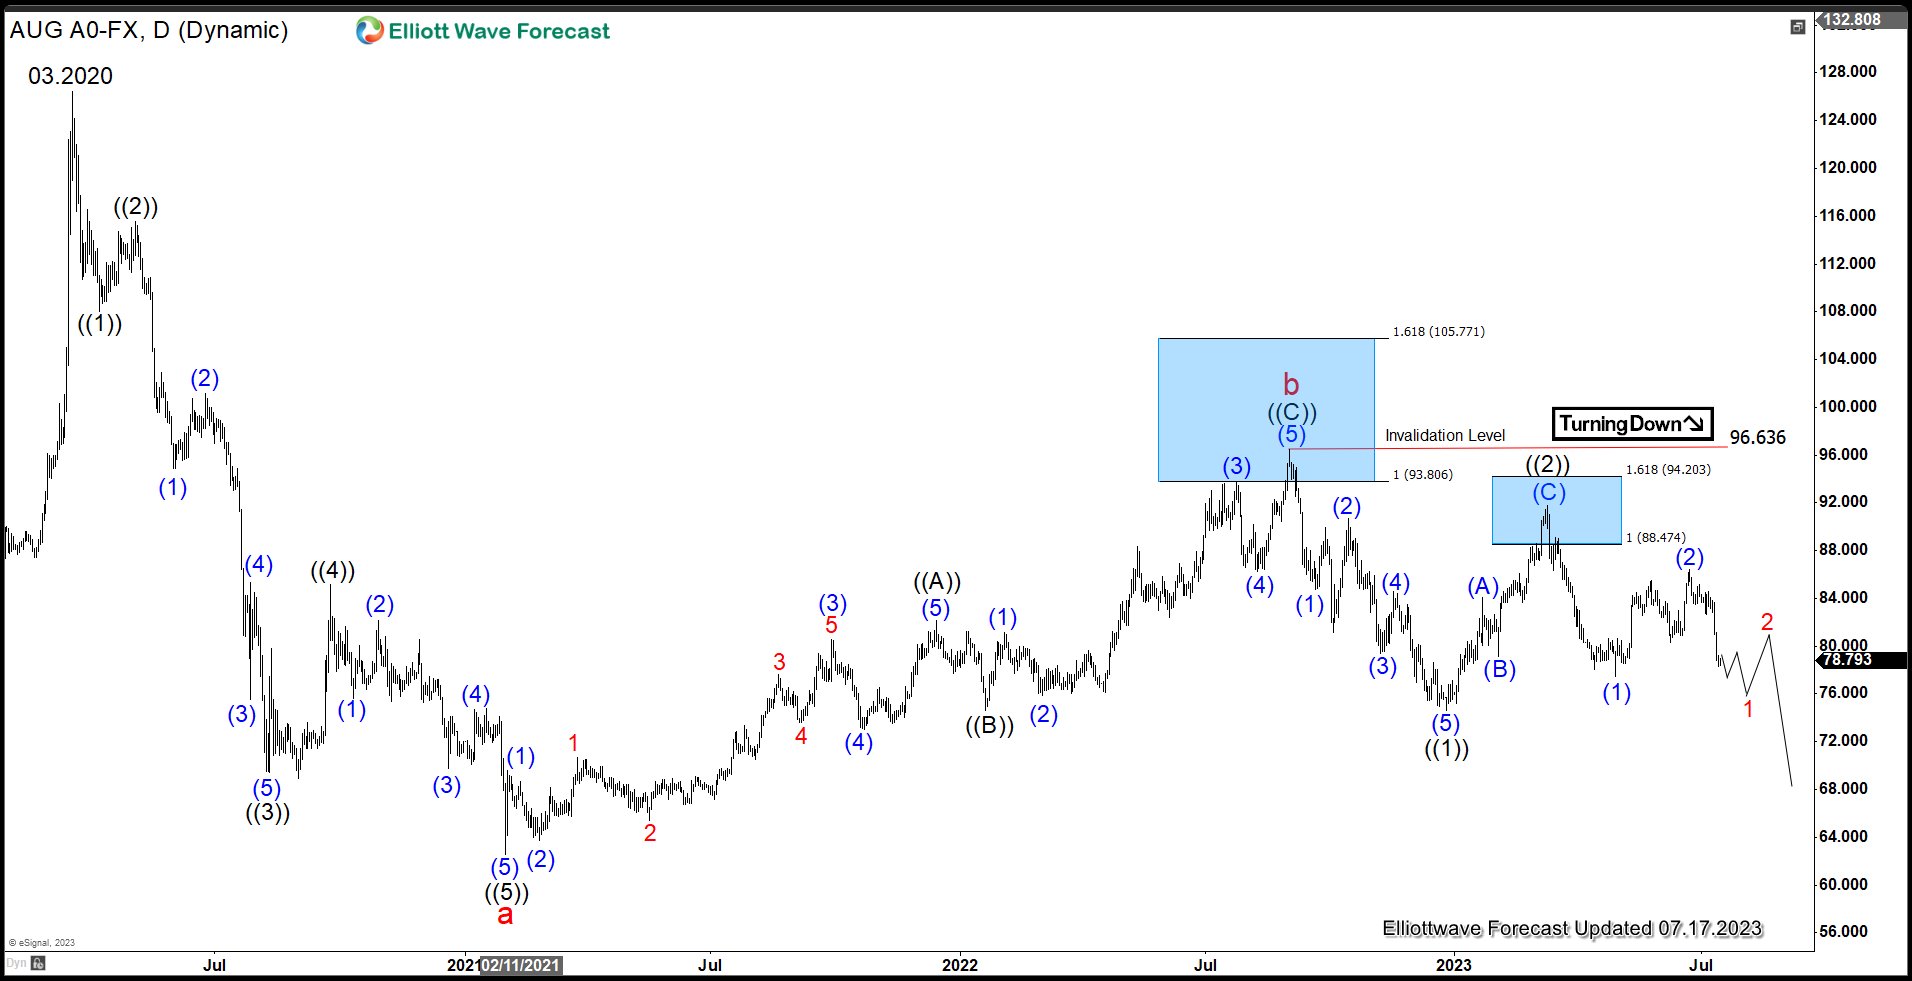
Daily Elliott Wave Chart of Gold-to-Silver ratio above shows that it has started to resume lower. A break below wave (1) at 77.46 would confirm that wave (2) corrective rally has ended at 86.394. The ratio has spent almost 1 year in a range trade since it formed the top on 9.1.2022 high at 96.489. The rally to 96.636 ended the correction to the cycle from March 2020 peak as wave b. Wave c lower is currently in progress as a 5 waves Elliott Wave structure. Down from wave b, wave ((1)) ended at 746.3 and rally in wave ((2)) ended at 91.819. Expect the ratio to extend lower in wave ((3)). As far as pivot at 96.636 high stays intact, expect rally to fail in 3, 7, or 11 swing and the ratio to extend lower.
As AUG has inverse correlation to the price of the underlying metals (gold and silver), this suggests that we should expect the price of gold and silver to continue higher in the second half of 2023.
免責事項:本記事で述べられている見解は著者の見解のみであり、Followmeの公式見解を反映するものではありません。Followmeは、提供された情報の正確性、完全性、信頼性について一切責任を負いません。また、書面で明示的に記載されている場合を除き、本記事の内容に基づいて行われたいかなる行動についても責任を負いません。

