| Scenario | |
|---|---|
| Timeframe | Weekly |
| Recommendation | SELL STOP |
| Entry Point | 32.40 |
| Take Profit | 27.20 |
| Stop Loss | 34.00 |
| Key Levels | 27.00, 27.20, 32.00, 32.40, 34.00, 36.00, 40.30 |
| Alternative scenario | |
|---|---|
| Recommendation | BUY STOP |
| Entry Point | 36.00 |
| Take Profit | 40.30 |
| Stop Loss | 34.00 |
| Key Levels | 27.00, 27.20, 32.00, 32.40, 34.00, 36.00, 40.30 |
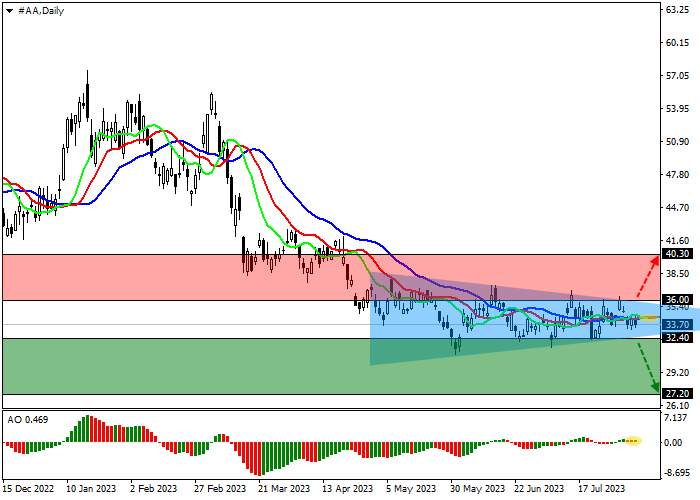
Shares of Alcoa Corp., one of the world's largest aluminum producers, are trading at 33.00.
On the daily chart, the price is holding within the global downtrend, again approaching the annual lows around 32.00.
On the four-hour chart, after several unsuccessful attempts to test the level of 32.00, the quotes formed a local Triangle pattern with dynamically narrowing boundaries at 36.00–32.40, in case of which the downward dynamics may increase to the level of 27.00.
Technical indicators maintain an unclear sell signal: the range of fluctuations of the EMA on the Alligator indicator remains narrowed, and the histogram of the AO oscillator, being in the sell zone, continues to form corrective bars.

Trading tips
Short positions can be opened after a continued decline in the asset, as well as price consolidation below the global low at 32.40 with the target of 27.20. Stop-loss — 34.00. Implementation time: 7 days and more.
Long positions should be opened after the price reverses and consolidates above the level of 36.00 with a target of 40.30. Stop-loss – 34.00.
免責事項:本記事で述べられている見解は著者の見解のみであり、Followmeの公式見解を反映するものではありません。Followmeは、提供された情報の正確性、完全性、信頼性について一切責任を負いません。また、書面で明示的に記載されている場合を除き、本記事の内容に基づいて行われたいかなる行動についても責任を負いません。

古いコメントはありません。ソファをつかむ最初のものになりましょう。