


| Scenario | |
|---|---|
| Timeframe | Weekly |
| Recommendation | SELL STOP |
| Entry Point | 239.40 |
| Take Profit | 218.75, 250.00 |
| Stop Loss | 255.30 |
| Key Levels | 250.00, 218.75, 250.00, 264.00, 181.25, 312.50 |
| Alternative scenario | |
|---|---|
| Recommendation | BUY STOP |
| Entry Point | 264.00 |
| Take Profit | 181.25, 312.50 |
| Stop Loss | 251.50 |
| Key Levels | 250.00, 218.75, 250.00, 264.00, 181.25, 312.50 |
Current trend
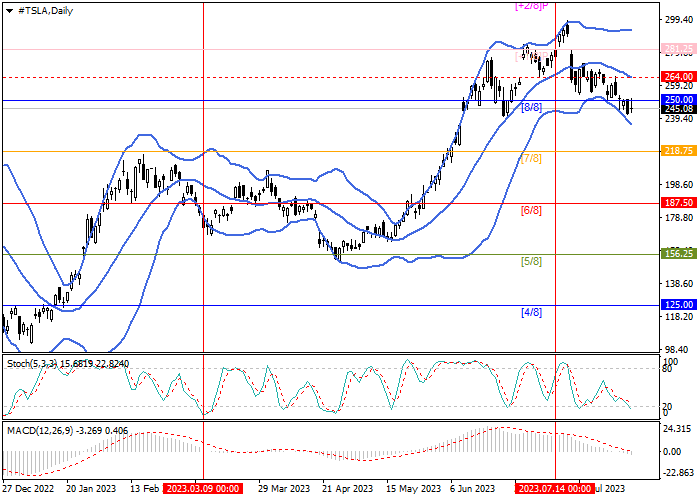
Shares of Tesla Inc., the world's leading manufacturer of electric cars, have continued to decline since the second half of last month, correcting against the mid-term upward trend.
During this time, the price reversed in the upper zone and returned to the main trading range, breaking the 250.00 mark (Murray level [8/8]). Further targets for the decline may be 218.75 (Murray level [7/8]) and 187.50 (Murray level [6/8]). If the level of 250.00 is broken out again, as well as the middle line of the Bollinger Bands (264.00), the quotes will be able to reach the area of 312.50 (Murray level [ 2/8]).
Technical indicators point out the continuation of a short-term downward trend: the Bollinger Bands and the Stochastic are directed downwards, the MACD histogram increases in the negative zone.
Support and resistance
Resistance levels: 250.00, 264.00, 181.25, 312.50.
Support levels: 218.75, 250.00.
Trading tips
Short positions can be opened from 239.40 with targets at 218.75, 250.00 and stop-loss at 255.30. Implementation period: 5-7 days.
Long positions can be opened above 264.00 with targets at 181.25, 312.50 and stop-loss at 251.50.
免責事項:本記事で述べられている見解は著者の見解のみであり、Followmeの公式見解を反映するものではありません。Followmeは、提供された情報の正確性、完全性、信頼性について一切責任を負いません。また、書面で明示的に記載されている場合を除き、本記事の内容に基づいて行われたいかなる行動についても責任を負いません。

