


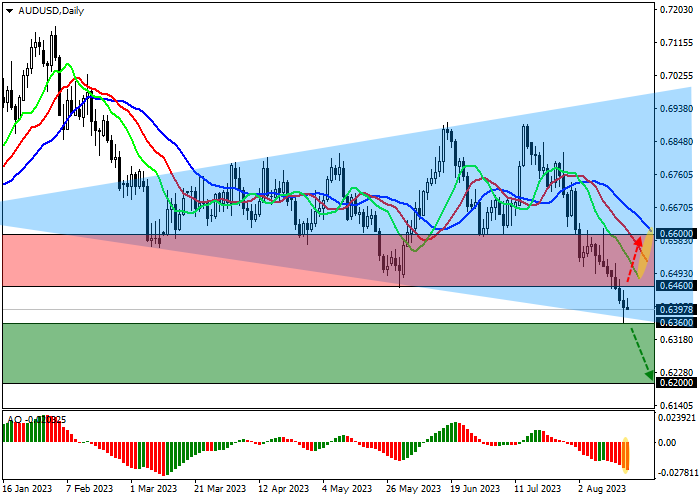
| Scenario | |
|---|---|
| Timeframe | Weekly |
| Recommendation | SELL STOP |
| Entry Point | 0.6360 |
| Take Profit | 0.6200 |
| Stop Loss | 0.6400 |
| Key Levels | 0.6200, 0.6360, 0.6460, 0.6600 |
| Alternative scenario | |
|---|---|
| Recommendation | BUY STOP |
| Entry Point | 0.6460 |
| Take Profit | 0.6600 |
| Stop Loss | 0.6400 |
| Key Levels | 0.6200, 0.6360, 0.6460, 0.6600 |
Current trend
The Australian currency continues to decline in the AUD/USD pair, holding at 0.6398.
The instrument is under pressure from poor data on the Australian labor market: the overall unemployment rate increased by 0.2%, amounting to 3.7%, mainly due to a decrease in the number of employed by 15.0K people and an increase in the number of unemployed by 36.0K people. The share of the economically active population fell to 66.7% from 66.8% before, and the employment-to-number ratio fell to 64.2 points from 64.4 points earlier. Thus, the Reserve Bank of Australia received a second negative signal, also to the recent release of the minutes of the last meeting against the ongoing pause in the “hawkish” cycle, which leaves officials with a difficult choice: to raise interest rates again, fighting inflation, or continue to monitor incoming data but focus on the problems of economic activity.
The dynamics of the US dollar has not changed since yesterday, and at the moment the quotes are above 103.0 points in the USD Index. The positions of the currency were supported by positive data on the number of initial applications for unemployment benefits, which amounted to 239.0K against 250.0K a week earlier, although the total number of citizens who applied for assistance from the state increased to 1.716M from 1.684M earlier. At the same time, the Federal Reserve Bank (FRB) of Philadelphia significantly raised the index of manufacturing activity to 12.0 points from –13.5 points earlier, signaling the market about the recovery of the sector.
Support and resistance
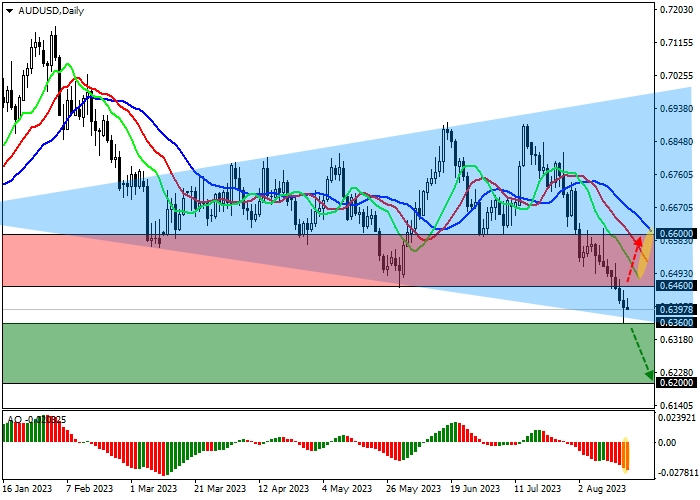
On the daily chart, the price is trading within the global Expanding formation pattern with dynamic boundaries 0.7000–0.6360, the implementation of which continues in a downtrend.
Technical indicators keep a stable sell signal: fast EMAs on the Alligator indicator move away from the signal line, and the AO oscillator histogram, being in the sell zone, forms more and more downward bars.
Support levels: 0.6360, 0.6200.
Resistance levels: 0.6460, 0.6600.
Trading tips
Short positions may be opened after the consolidation below the support level of 0.6360 with the target at 0.6200. Stop loss – 0.6400. Implementation period: 7 days or more.
Long positions may be opened after the consolidation above the resistance level of 0.6460 with the target at 0.6600. Stop loss – 0.6400.
免責事項:本記事で述べられている見解は著者の見解のみであり、Followmeの公式見解を反映するものではありません。Followmeは、提供された情報の正確性、完全性、信頼性について一切責任を負いません。また、書面で明示的に記載されている場合を除き、本記事の内容に基づいて行われたいかなる行動についても責任を負いません。

