


Scenario Timeframe Weekly Recommendation SELL STOP Entry Point 7200.0 Take Profit 6970.0 Stop Loss 7300.0 Key Levels 6970.0, 7200.0, 7380.0, 7580.0
Alternative scenario Recommendation BUY STOP Entry Point 7380.0 Take Profit 7580.0 Stop Loss 7300.0 Key Levels 6970.0, 7200.0, 7380.0, 7580.0
Current trend
The quotes of the FTSE 100 index show corrective dynamics around 7275.0.
Traditionally, the corporate reporting season ends with the publication of financial data of foreign issuers, whose shares are listed on the London Stock Exchange. Thus, the Swedish company focused on the timber and pulp and paper industry, Holmen AB, recorded revenues of 5.75B Swedish kronor, which is not only inferior to the forecasted 5.86B Swedish kronor but also 6.22B Swedish kronor a quarter earlier. Earnings per share reached 5.50 Swedish kronor from preliminary estimates of 5.63 Swedish kronor and a previous figure of 8.50 Swedish kronor. Danish medical device developer and manufacturer Coloplast A/S was in a similar situation, with revenue of 6.11B Danish kronor, down from an expected 6.18B Danish kronor, and earnings per share dropping to 5.88 Danish kronor from the preliminary estimate of 5. 91 Danish kroner.
There is local growth in the UK domestic bond market today: popular 10-year bonds are traded at a rate of 4.775%, rising by 0.59% compared to yesterday’s close, while conservative 20-year assets add 0.76% and are around 5.014%, while global 30-year bonds are holding at 4.990%, correcting 1.15% since the start of trading.
The growth leaders in the index are Rio Tinto Group ( 1.69%), Glencore International AG ( 0.96%), BHP Group Ltd. ( 0.91%), and Smith & Nephew Plc. ( 0.89%).
Among the leaders of decline are Ocado Group Plc. (–5.54%), Entain Plc. (–4.82%), and BAE Systems Plc. (–4.66%).
Support and resistance
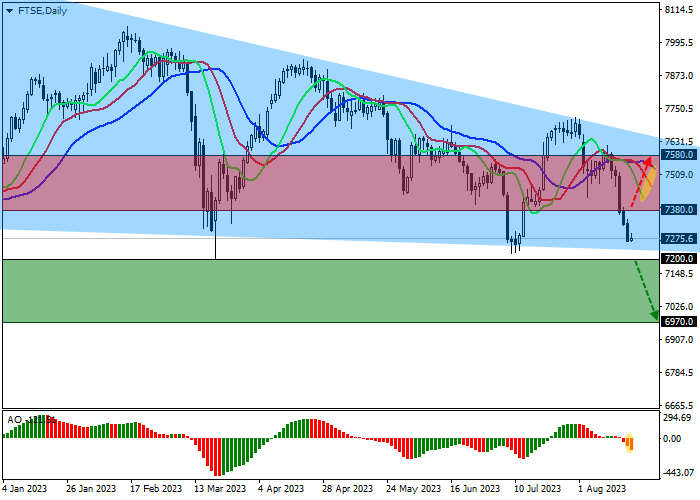
On the daily chart, the index quotes continue their local correction, falling towards the support line of the global Triangle pattern around 7200.0.
Technical indicators are in the state of a sell signal: the range of EMA fluctuations on the Alligator indicator expands downwards, and the AO oscillator histogram is forming new correction bars, falling in the sell zone.
Support levels: 7200.0, 6970.0.
Resistance levels: 7380.0, 7580.0.
Trading tips
Short positions may be opened after the consolidation below the local support level of 7200.0 with the target at 6970.0. Stop loss – 7300.0. Implementation period: 7 days or more.
Long positions may be opened after the consolidation above the local resistance level of 7380.0 with the target at 7580.0 and stop loss 7300.0.
| Scenario | |
|---|---|
| Timeframe | Weekly |
| Recommendation | SELL STOP |
| Entry Point | 7200.0 |
| Take Profit | 6970.0 |
| Stop Loss | 7300.0 |
| Key Levels | 6970.0, 7200.0, 7380.0, 7580.0 |
| Alternative scenario | |
|---|---|
| Recommendation | BUY STOP |
| Entry Point | 7380.0 |
| Take Profit | 7580.0 |
| Stop Loss | 7300.0 |
| Key Levels | 6970.0, 7200.0, 7380.0, 7580.0 |
Current trend
The quotes of the FTSE 100 index show corrective dynamics around 7275.0.
Traditionally, the corporate reporting season ends with the publication of financial data of foreign issuers, whose shares are listed on the London Stock Exchange. Thus, the Swedish company focused on the timber and pulp and paper industry, Holmen AB, recorded revenues of 5.75B Swedish kronor, which is not only inferior to the forecasted 5.86B Swedish kronor but also 6.22B Swedish kronor a quarter earlier. Earnings per share reached 5.50 Swedish kronor from preliminary estimates of 5.63 Swedish kronor and a previous figure of 8.50 Swedish kronor. Danish medical device developer and manufacturer Coloplast A/S was in a similar situation, with revenue of 6.11B Danish kronor, down from an expected 6.18B Danish kronor, and earnings per share dropping to 5.88 Danish kronor from the preliminary estimate of 5. 91 Danish kroner.
There is local growth in the UK domestic bond market today: popular 10-year bonds are traded at a rate of 4.775%, rising by 0.59% compared to yesterday’s close, while conservative 20-year assets add 0.76% and are around 5.014%, while global 30-year bonds are holding at 4.990%, correcting 1.15% since the start of trading.
The growth leaders in the index are Rio Tinto Group ( 1.69%), Glencore International AG ( 0.96%), BHP Group Ltd. ( 0.91%), and Smith & Nephew Plc. ( 0.89%).
Among the leaders of decline are Ocado Group Plc. (–5.54%), Entain Plc. (–4.82%), and BAE Systems Plc. (–4.66%).
Support and resistance
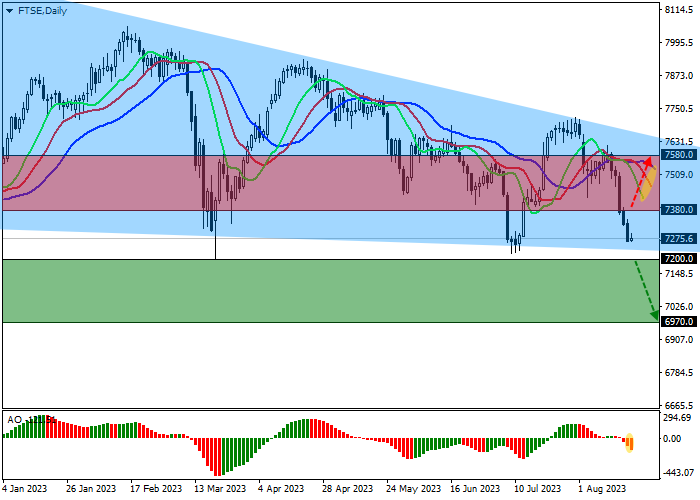
On the daily chart, the index quotes continue their local correction, falling towards the support line of the global Triangle pattern around 7200.0.
Technical indicators are in the state of a sell signal: the range of EMA fluctuations on the Alligator indicator expands downwards, and the AO oscillator histogram is forming new correction bars, falling in the sell zone.
Support levels: 7200.0, 6970.0.
Resistance levels: 7380.0, 7580.0.
Trading tips
Short positions may be opened after the consolidation below the local support level of 7200.0 with the target at 6970.0. Stop loss – 7300.0. Implementation period: 7 days or more.
Long positions may be opened after the consolidation above the local resistance level of 7380.0 with the target at 7580.0 and stop loss 7300.0.
免責事項:本記事で述べられている見解は著者の見解のみであり、Followmeの公式見解を反映するものではありません。Followmeは、提供された情報の正確性、完全性、信頼性について一切責任を負いません。また、書面で明示的に記載されている場合を除き、本記事の内容に基づいて行われたいかなる行動についても責任を負いません。

