


| Scenario | |
|---|---|
| Timeframe | Intraday |
| Recommendation | SELL STOP |
| Entry Point | 0.5900 |
| Take Profit | 0.5773 |
| Stop Loss | 0.5970 |
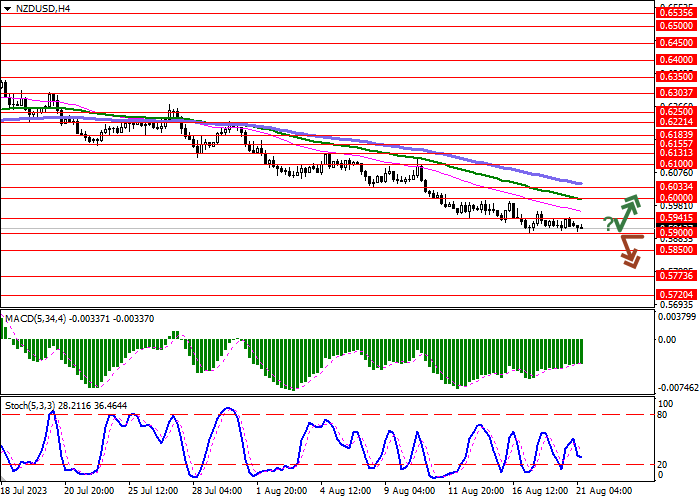
| Key Levels | 0.5720, 0.5773, 0.5850, 0.5900, 0.5941, 0.6000, 0.6033, 0.6100 |
| Alternative scenario | |
|---|---|
| Recommendation | BUY STOP |
| Entry Point | 0.5941 |
| Take Profit | 0.6033 |
| Stop Loss | 0.5900 |
| Key Levels | 0.5720, 0.5773, 0.5850, 0.5900, 0.5941, 0.6000, 0.6033, 0.6100 |
Current trend
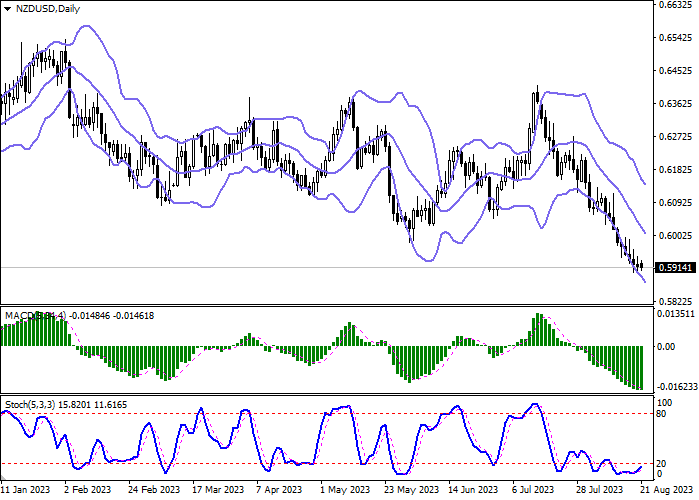
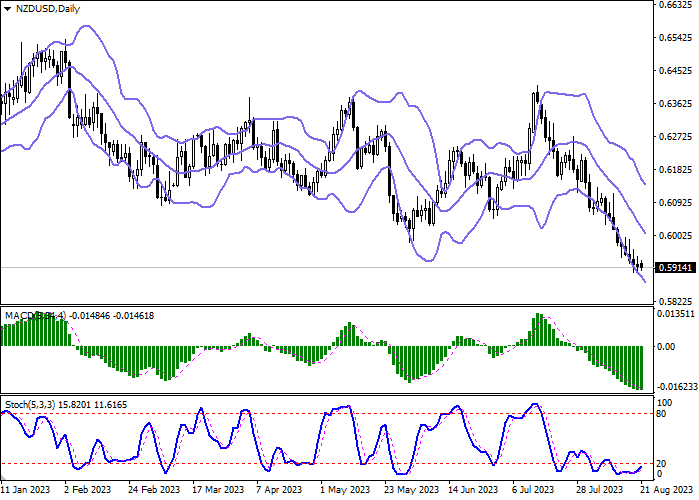
The NZD/USD pair shows a moderate decline, developing a confident downtrend in the short term. The instrument is testing 0.5915 for a breakdown, above the November 2022 all-time lows.
The pressure on the instrument is still exerted by negative forecasts regarding one of the main partners of New Zealand, China. Against this background, in July, the volume of Exports from New Zealand decreased from 6.18 billion dollars to 5.45 billion dollars, while Imports strengthened from 6.29 billion dollars to 6.56 billion dollars, which led to an increase in the Trade Deficit from -111.0 million dollars to -1.107 billion dollars.
The follow-up statement issued following the decision of the Reserve Bank of New Zealand (RBNZ) to keep the interest rate at 5.50%, noted that household spending is declining, having a positive impact on inflation, while the situation in the labor market is gradually improving. However, officials stressed that there are risks associated with a slowdown in macroeconomic indicators. In turn, the People's Bank of China decided to cut the interest rate by 10 basis points from 3.55% to 3.45%, while analysts expected a 15 basis point adjustment to 3.40%.
Investors are preparing for speeches by US Federal Reserve officials, including the Chair of the regulator, Jerome Powell, as well as the annual symposium in Jackson Hole, which may present new forecasts regarding the prospects for monetary policy in the US.
Support and resistance
Bollinger Bands on the daily chart show a steady decline. The price range is changing slightly, but remains rather spacious for the current level of activity in the market. MACD indicator is trying to reverse upwards and form a new buy signal (the histogram has to consolidate above the signal line). Stochastic, located near its lows, retains an uncertain upward direction, signaling in favor of the development of "bullish" trend in the near future.
Resistance levels: 0.5941, 0.6000, 0.6033, 0.6100.
Support levels: 0.5900, 0.5850, 0.5773, 0.5720.
Trading tips
Short positions may be opened after a breakdown of 0.5900 with the target at 0.5773. Stop-loss — 0.5970. Implementation time: 2-3 days.
A rebound from 0.5900 as from support followed by a breakout of 0.5941 may become a signal for opening new long positions with the target at 0.6033. Stop-loss — 0.5900.
免責事項:本記事で述べられている見解は著者の見解のみであり、Followmeの公式見解を反映するものではありません。Followmeは、提供された情報の正確性、完全性、信頼性について一切責任を負いません。また、書面で明示的に記載されている場合を除き、本記事の内容に基づいて行われたいかなる行動についても責任を負いません。

