


| Scenario | |
|---|---|
| Timeframe | Intraday |
| Recommendation | BUY STOP |
| Entry Point | 1.0930 |
| Take Profit | 1.1000 |
| Stop Loss | 1.0891 |
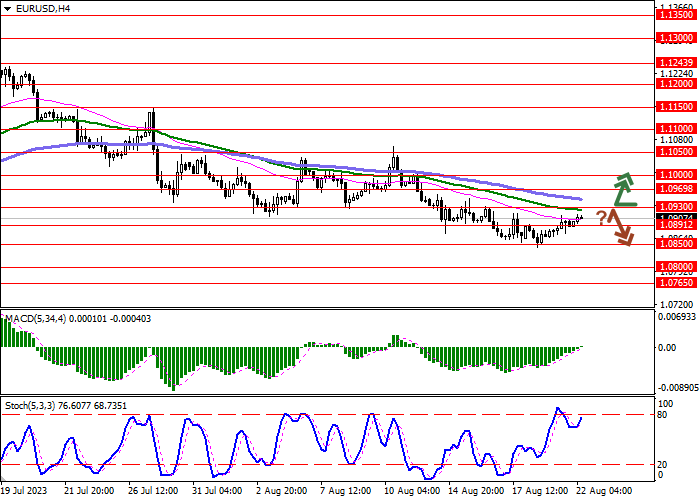
| Key Levels | 1.0765, 1.0800, 1.0850, 1.0891, 1.0930, 1.0969, 1.1000, 1.1050 |
| Alternative scenario | |
|---|---|
| Recommendation | SELL STOP |
| Entry Point | 1.0890 |
| Take Profit | 1.0800 |
| Stop Loss | 1.0940 |
| Key Levels | 1.0765, 1.0800, 1.0850, 1.0891, 1.0930, 1.0969, 1.1000, 1.1050 |
Current trend
The EUR/USD pair shows active growth, developing the "bullish" momentum formed the day before and allowing the instrument to retreat from the local lows of July 6. The euro is trying to consolidate above 1.0910, receiving support from technical factors.
At the end of the week, investors are waiting for the annual US Federal Reserve Economic Policy Symposium in Jackson Hole, where theses can be heard both in favor of maintaining the interest rate and for its further increase. According to analysts' current forecasts, with a probability of more than 86.0%, the regulator will leave the cost of borrowing unchanged during its September meeting. Meanwhile, the likelihood of another 25 basis point adjustment before the end of the year is about 35.0%. In turn, the European Central Bank (ECB) is expected to take somewhat more confident steps towards tightening monetary policy due to too much difference between the monetary policy pursued in the EU and the US.
At the same time, macroeconomic statistics on inflation in the euro area reduces the "hawkish" sentiment of the ECB board members. In particular, data from Germany published the day before indicated a slowdown in the Producer Price Index in July by 1.1% after -0.3% in the previous month, while analysts had forecast -0.2%. In annual terms, the indicator fell sharply by 6.0% after rising by 0.1% a month earlier, while the market expected -5.1%. In turn, the final data on inflation in the euro area for July showed a decrease in the Consumer Price Index from 0.3% to -0.1% in monthly terms, and from 5.5% to 5.3% in annual terms, while the monthly Core CPI fell from 0.4% to -0.1%, and the annual value was fixed at the same level of 5.5%. In addition, the indicator for the services sector has adjusted from 5.4% to 5.6%, causing concern among experts, since this indicator directly depends on the level of wages and the state of the national labor market, which is still under pressure. However, in general, price pressures in European countries are gradually easing, and core inflation is likely to have peaked, which will allow ECB officials to end the "hawkish" cycle; however, analysts believe that the interest rate will be adjusted at least one more time to 4.00%. This may be facilitated by the current decline in investment in the economy and the dynamics of consumer demand.
On Wednesday, August 23, S&P Global's August Manufacturing and Services PMIs for the eurozone and the US will be released.
Support and resistance
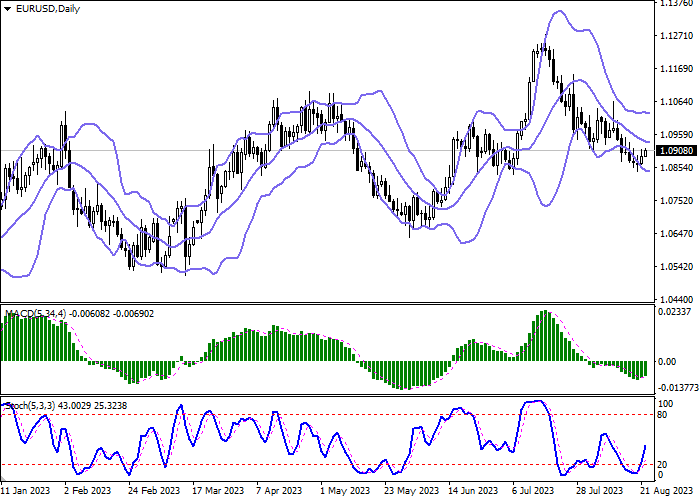
On the D1 chart, Bollinger Bands are reversing horizontally. The price range is expanding slightly, but remains spacious for the current level of activity in the market. MACD has reversed to growth having formed a new buy signal (located above the signal line). Stochastic keeps a confident upward direction and is located approximately in the center of its area.
Resistance levels: 1.0930, 1.0969, 1.1000, 1.1050.
Support levels: 1.0891, 1.0850, 1.0800, 1.0765.
Trading tips
Long positions can be opened after a breakout of 1.0930 with the target of 1.1000. Stop-loss — 1.0891. Implementation time: 1-2 days.
A rebound from 1.0930 as from resistance, followed by a breakdown of 1.0891 may become a signal for opening of new short positions with the target at 1.0800. Stop-loss — 1.0940.
免責事項:本記事で述べられている見解は著者の見解のみであり、Followmeの公式見解を反映するものではありません。Followmeは、提供された情報の正確性、完全性、信頼性について一切責任を負いません。また、書面で明示的に記載されている場合を除き、本記事の内容に基づいて行われたいかなる行動についても責任を負いません。

