


| Scenario | |
|---|---|
| Timeframe | Weekly |
| Recommendation | BUY STOP |
| Entry Point | 535.05 |
| Take Profit | 575.00 |
| Stop Loss | 520.00 |
| Key Levels | 473.00, 504.00, 535.00, 575.00 |
| Alternative scenario | |
|---|---|
| Recommendation | SELL STOP |
| Entry Point | 503.95 |
| Take Profit | 473.00 |
| Stop Loss | 520.00 |
| Key Levels | 473.00, 504.00, 535.00, 575.00 |
Current trend
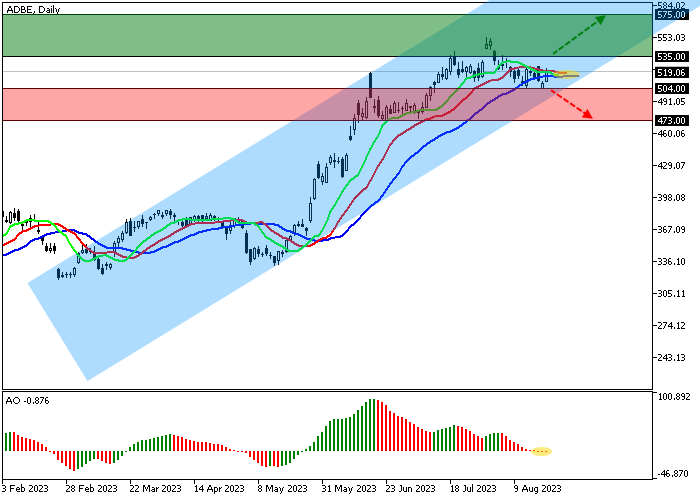
The stocks of the American software development giant Adobe Inc. are still in an uptrend and are currently trading at 519.00.
The world's leading antimonopoly regulators continue to carefully evaluate potential takeover deals that could disrupt competition in high-tech areas. So, last week it became known that officials have launched an investigation into a possible agreement between Adobe Inc. and Figma, which is estimated at 20.0B dollars. The European Commission believes that this agreement may lead to restrictions on free competition in the supply of interactive design tools, which Figma is developing. Thus, the deal will be blocked at least until December 14, after which the EU antimonopoly authority will make a final decision.
As for the local dynamics, analysts are positive about Q3. At least, representatives of Bank of America Securities Inc. raised the target price for the issuer's shares to 630.0 dollars from 575.0 dollars earlier. Experts believe that the widespread use of a generative tool for creating artificial intelligence content Firefly can begin to bring significant revenue to the company if Adobe Inc. decides on a strategy for monetization of this solution.
Support and resistance
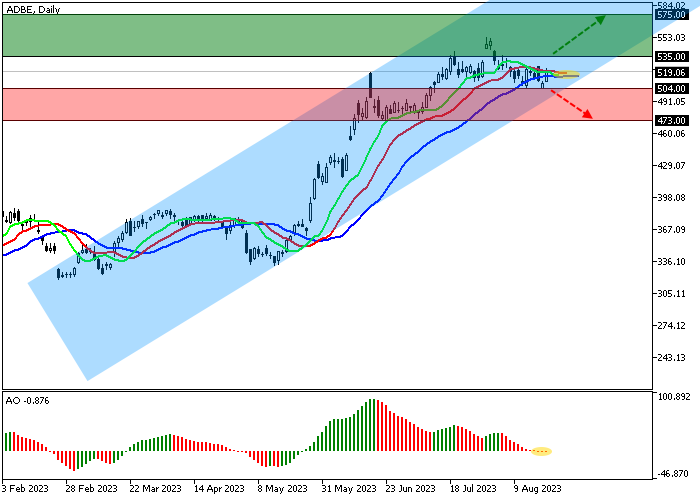
On the daily chart, the shares are still trading in a global uptrend, slightly moving away from the support line of the global channel at around 500.00.
Technical indicators continue to hold the buy signal, which does not exclude the possibility of a local downward movement: fast EMAs on the alligator indicator are above the signal line, and the AO histogram is trading in a positive zone, forming new correction bars.
Support levels: 504.00, 473.00.
Resistance levels: 535.00, 575.00.
Trading tips
If the asset continues local growth and the price consolidates above the resistance level of 535.00, long positions will be relevant with a target at 575.00. Stop-loss – 520.00. Implementation time: 7 days and more.
If the asset reverses and declines and the price consolidates below the support level at 504.00, short positions can be opened with a target at 473.00 and stop-loss at 520.00.
免責事項:本記事で述べられている見解は著者の見解のみであり、Followmeの公式見解を反映するものではありません。Followmeは、提供された情報の正確性、完全性、信頼性について一切責任を負いません。また、書面で明示的に記載されている場合を除き、本記事の内容に基づいて行われたいかなる行動についても責任を負いません。

