


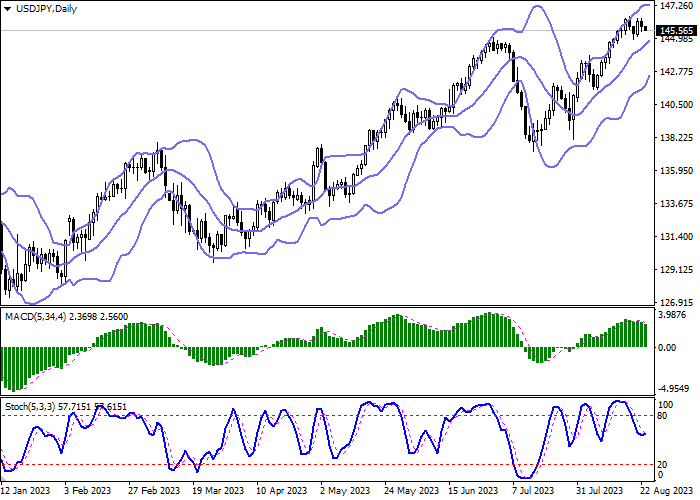
Scenario Timeframe Intraday Recommendation SELL STOP Entry Point 145.00 Take Profit 144.00 Stop Loss 145.50 Key Levels 142.54, 143.48, 144.00, 145.00, 146.00, 146.54, 147.00, 148.00
Alternative scenario Recommendation BUY STOP Entry Point 146.00 Take Profit 147.00 Stop Loss 145.50 Key Levels 142.54, 143.48, 144.00, 145.00, 146.00, 146.54, 147.00, 148.00
Current trend
The USD/JPY pair is declining, developing an uncertain "bearish" momentum formed the day before. The instrument is testing the level of 145.60 for a breakdown, returning to the trading levels of last Friday.
The yen is moderately supported by macroeconomic statistics on business activity in Japan: the Manufacturing PMI from Jibun Bank in August corrected from 49.6 points to 49.7 points, while analysts expected it to decline to 49.5 points. In turn, the data from the US published the day before also contributed to the development of the downtrend for the instrument. Existing Home Sales in July decreased by 2.2% after -3.3% in the previous month, and in absolute terms the indicator went down from 4.16 million to 4.07 million, while analysts expected a decrease to 4.15 million.
On Tuesday, the Bank of Japan Governor Kazuo Ueda and Prime Minister Fumio Kishida held talks on the country's economic development, but did not discuss the recent volatility of the national currency when officials feared that the yen could fall to 145.00. Last month, the Bank of Japan changed Yield Curve Control (YCC) parameters to allow long-term rates to rise more freely, while highlighting the determination to maintain the course of ultra-loose monetary policy, focusing investors on the difference between US and Japanese bond yields, which allowed the USD/JPY pair to hit 146.56 last Thursday. This caused fears that the monetary authorities may again resort to foreign exchange interventions.
The focus of investors today will be statistics on business activity in the US from S&P Global, as well as July data on the dynamics of New Home Sales. In addition, investors are waiting for the speech of the Chair of the US Federal Reserve Jerome Powell as part of the annual Economic Policy Symposium in Jackson Hole, during which there may be signals in favor of a possible tightening of the monetary policy of the regulator before the end of this year.
In Japan, the publication of August data on the dynamics of inflation in the Tokyo region is expected on Friday: forecasts suggest a slight slowdown in the Consumer Price Index from 3.2% to 3.0%.
Support and resistance
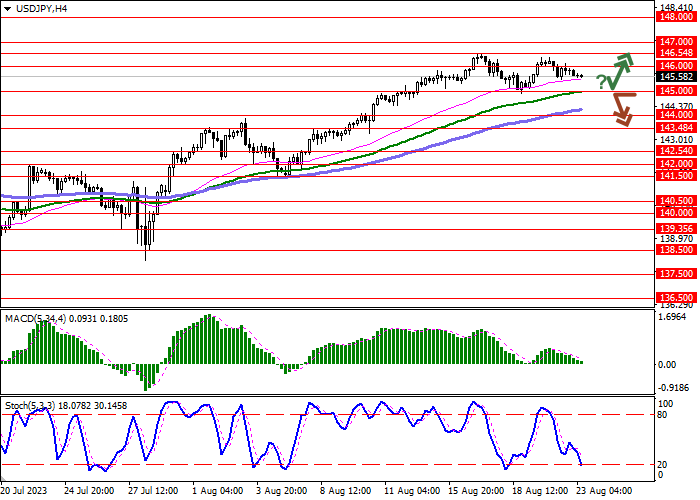
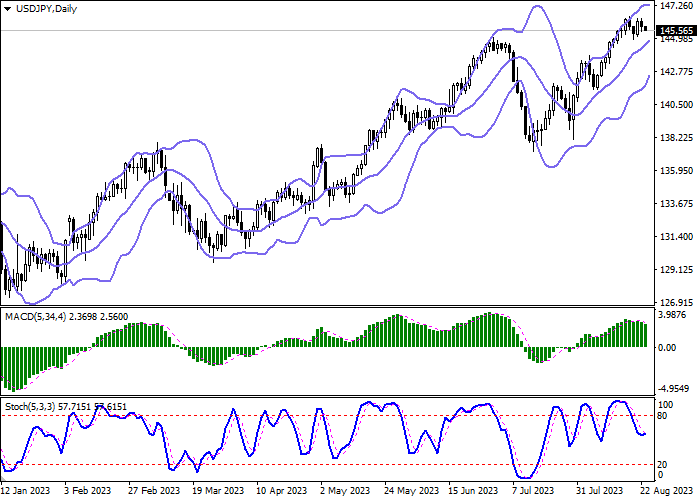
Bollinger Bands on the daily chart show a steady increase. The price range is narrowing, reacting to the appearance of ambiguous trading dynamics in the near future. MACD is falling, keeping a relatively strong sell signal (the histogram is below the signal line). Stochastic, which had previously retreated from its highs, is reversing upwards again, being located not far from the level of "80". One should wait for development of the situation.
Resistance levels: 146.00, 146.54, 147.00, 148.00.
Support levels: 145.00, 144.00, 143.48, 142.54.
Trading tips
Short positions may be opened after a breakdown of 145.00 with the target at 144.00. Stop-loss — 145.50. Implementation time: 1-2 days.
A rebound from 145.00 as from support followed by a breakout of 146.00 may become a signal for opening new long positions with the target at 147.00. Stop-loss — 145.50.
| Scenario | |
|---|---|
| Timeframe | Intraday |
| Recommendation | SELL STOP |
| Entry Point | 145.00 |
| Take Profit | 144.00 |
| Stop Loss | 145.50 |
| Key Levels | 142.54, 143.48, 144.00, 145.00, 146.00, 146.54, 147.00, 148.00 |
| Alternative scenario | |
|---|---|
| Recommendation | BUY STOP |
| Entry Point | 146.00 |
| Take Profit | 147.00 |
| Stop Loss | 145.50 |
| Key Levels | 142.54, 143.48, 144.00, 145.00, 146.00, 146.54, 147.00, 148.00 |
Current trend
The USD/JPY pair is declining, developing an uncertain "bearish" momentum formed the day before. The instrument is testing the level of 145.60 for a breakdown, returning to the trading levels of last Friday.
The yen is moderately supported by macroeconomic statistics on business activity in Japan: the Manufacturing PMI from Jibun Bank in August corrected from 49.6 points to 49.7 points, while analysts expected it to decline to 49.5 points. In turn, the data from the US published the day before also contributed to the development of the downtrend for the instrument. Existing Home Sales in July decreased by 2.2% after -3.3% in the previous month, and in absolute terms the indicator went down from 4.16 million to 4.07 million, while analysts expected a decrease to 4.15 million.
On Tuesday, the Bank of Japan Governor Kazuo Ueda and Prime Minister Fumio Kishida held talks on the country's economic development, but did not discuss the recent volatility of the national currency when officials feared that the yen could fall to 145.00. Last month, the Bank of Japan changed Yield Curve Control (YCC) parameters to allow long-term rates to rise more freely, while highlighting the determination to maintain the course of ultra-loose monetary policy, focusing investors on the difference between US and Japanese bond yields, which allowed the USD/JPY pair to hit 146.56 last Thursday. This caused fears that the monetary authorities may again resort to foreign exchange interventions.
The focus of investors today will be statistics on business activity in the US from S&P Global, as well as July data on the dynamics of New Home Sales. In addition, investors are waiting for the speech of the Chair of the US Federal Reserve Jerome Powell as part of the annual Economic Policy Symposium in Jackson Hole, during which there may be signals in favor of a possible tightening of the monetary policy of the regulator before the end of this year.
In Japan, the publication of August data on the dynamics of inflation in the Tokyo region is expected on Friday: forecasts suggest a slight slowdown in the Consumer Price Index from 3.2% to 3.0%.
Support and resistance
Bollinger Bands on the daily chart show a steady increase. The price range is narrowing, reacting to the appearance of ambiguous trading dynamics in the near future. MACD is falling, keeping a relatively strong sell signal (the histogram is below the signal line). Stochastic, which had previously retreated from its highs, is reversing upwards again, being located not far from the level of "80". One should wait for development of the situation.
Resistance levels: 146.00, 146.54, 147.00, 148.00.
Support levels: 145.00, 144.00, 143.48, 142.54.
Trading tips
Short positions may be opened after a breakdown of 145.00 with the target at 144.00. Stop-loss — 145.50. Implementation time: 1-2 days.
A rebound from 145.00 as from support followed by a breakout of 146.00 may become a signal for opening new long positions with the target at 147.00. Stop-loss — 145.50.
免責事項:本記事で述べられている見解は著者の見解のみであり、Followmeの公式見解を反映するものではありません。Followmeは、提供された情報の正確性、完全性、信頼性について一切責任を負いません。また、書面で明示的に記載されている場合を除き、本記事の内容に基づいて行われたいかなる行動についても責任を負いません。

