


| Scenario | |
|---|---|
| Timeframe | Weekly |
| Recommendation | SELL STOP |
| Entry Point | 34200.0 |
| Take Profit | 33400.0 |
| Stop Loss | 34600.0 |
| Key Levels | 33400.0, 34200.0, 34900.0, 35700.0 |
| Alternative scenario | |
|---|---|
| Recommendation | BUY STOP |
| Entry Point | 34900.0 |
| Take Profit | 35700.0 |
| Stop Loss | 34500.0 |
| Key Levels | 33400.0, 34200.0, 34900.0, 35700.0 |
Current trend
The Dow Jones index is correcting in the local trend at around 34543.0. Stock indices in the US retreated significantly from their highs on the background of stable growth of bonds and the end of the publication period for corporate reports.
Among the companies that presented their financial results this week, there are those that shape the trends in the index. The report from one of the leading retailers in the US, Lowe's Companies Inc., posted revenue of 25.00 billion dollars against a forecast of 24.97 billion dollars and earnings per share of 4.56 dollars, also above the 4.47 dollars that analysts had expected. GPU maker Nvidia Corp. posted record revenue of 13.51 billion dollars, beating the 11.13 billion dollars forecast, and earnings per share of 2.70 dollars, higher than the expected 2.07 dollars.
In turn, the upward trend continues on the US bond market. At the beginning of the week, auctions were held for the placement of 3- and 6-month bills, the yield rates on which amounted to 5.300% and 5.295%, slightly exceeding 5.295% and 5.290% fixed last week.
The growth leaders in the index are Merck & Company Inc. ( 3.80%), Intel Inc. ( 3.31%), Apple Inc. ( 2.19%).
Among the leaders of the decline are Nike Inc. (-2.67%), Johnson & Johnson (-0.90%), Dow Inc. (-0.72%).
Support and resistance
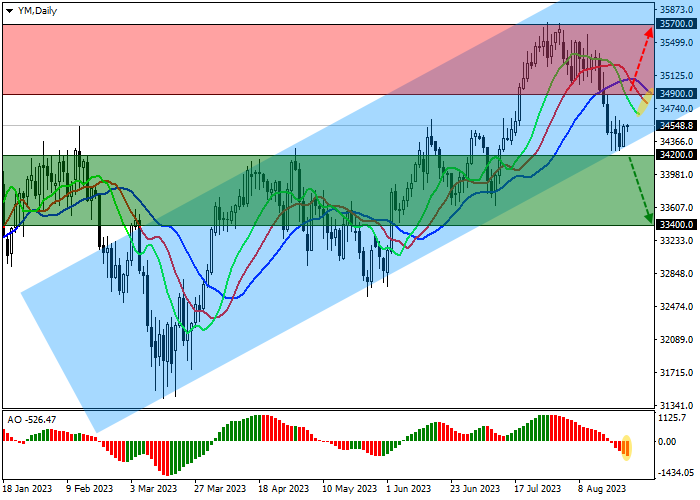
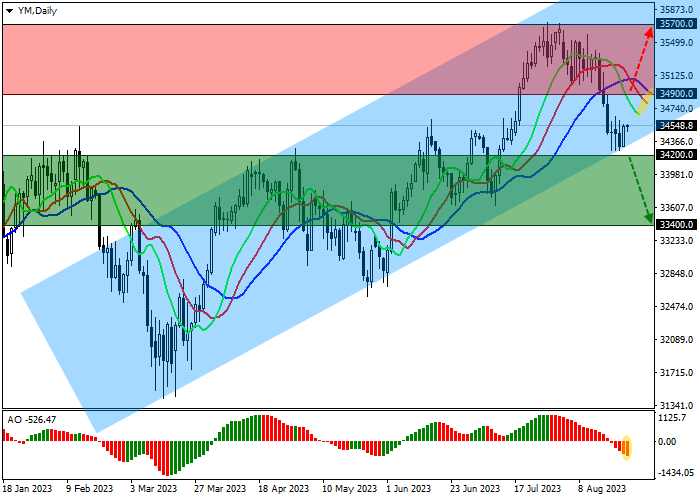
On the daily chart, the index quotes continue their corrective dynamics, trading within the global rising channel with the boundaries of 36300.0–34300.0.
Technical indicators have already reversed and issued a new sell signal: the range of EMA fluctuations on the Alligator indicator started expanding in the direction of decline, and the histogram of the AO oscillator is forming new descending bars, falling in the sales zone.
Support levels: 34200.0, 33400.0.
Resistance levels: 34900.0, 35700.0.
Trading tips
If the asset reverses and contiues declining and the price consolidates below the local support level of 34200.0, short positions can be opened with the target at 33400.0. Stop-loss — 34600.0. Implementation time: 7 days and more.
If the local growth continues, long positions that can be opened if the price overcomes the channel resistance at 34900.0 with a target at 35700.0 and stop-loss at 34500.0 will be relevant.
免責事項:本記事で述べられている見解は著者の見解のみであり、Followmeの公式見解を反映するものではありません。Followmeは、提供された情報の正確性、完全性、信頼性について一切責任を負いません。また、書面で明示的に記載されている場合を除き、本記事の内容に基づいて行われたいかなる行動についても責任を負いません。

