


Scenario Timeframe Weekly Recommendation BUY STOP Entry Point 82.15 Take Profit 86.20 Stop Loss 80.00 Key Levels 77.00, 79.60, 82.10, 86.20
Alternative scenario Recommendation SELL STOP Entry Point 79.55 Take Profit 77.00 Stop Loss 81.00 Key Levels 77.00, 79.60, 82.10, 86.20
Current trend
The price of North American WTI Crude Oil is correcting within an uptrend, trading at 81.24.
The current trend is due to the reports of another increase in oil supplies from the Russian Federation after two months of reduction: over the past week, crude oil exports by sea increased by 880.0K barrels per day compared to an increase in the first three weeks of August by 40.0K barrels per day. Last week, the cumulative increase was 3.4M barrels per day, close to late spring levels. Experts note that even with the current supply level Russia complies with the OPEC agreements to reduce exports in August by 500.0K barrels per day.
American oil reserves continue to decline: according to the report from the American Petroleum Institute (API), last week they adjusted by –11.486M barrels compared to –2.418M barrels earlier. It is expected that the data of the Energy Information Administration of the US Department of Energy (EIA) will reflect a change in the indicator by –3.267M barrels but given the statistics from the API, this value may turn out to be much higher, which will support oil quotes.
Support and resistance
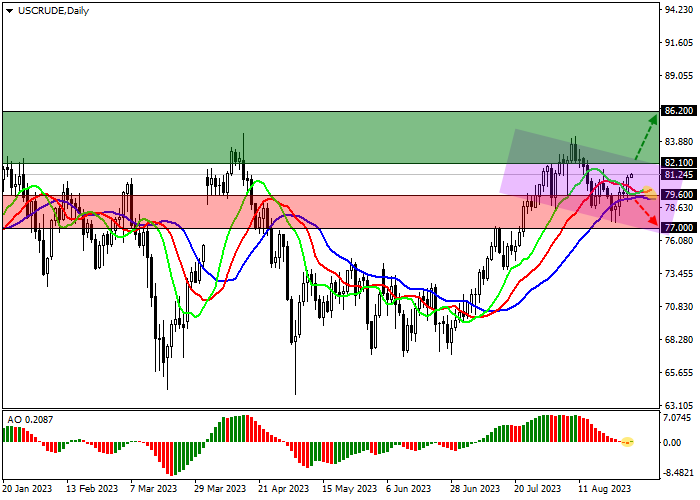
On the daily chart, the trading instrument is correcting upward, forming a local downward channel, which can work as a Flag pattern with a sales level of 82.00.
Technical indicators strengthen the buy signal: fast EMAs on the Alligator indicator expand the range of fluctuations, and the AO histogram forms ascending bars, rising in the buy zone.
Resistance levels: 82.10, 86.20.
Support levels: 79.60, 77.00.
Trading tips
Long positions may be opened after the price rises and consolidates above 82.10 with the target at 86.20. Stop loss — 80.00. Implementation period: 7 days or more.
Short positions may be opened after the price declines and consolidates below 79.60 with the target at 77.00. Stop loss — 81.00.
| Scenario | |
|---|---|
| Timeframe | Weekly |
| Recommendation | BUY STOP |
| Entry Point | 82.15 |
| Take Profit | 86.20 |
| Stop Loss | 80.00 |
| Key Levels | 77.00, 79.60, 82.10, 86.20 |
| Alternative scenario | |
|---|---|
| Recommendation | SELL STOP |
| Entry Point | 79.55 |
| Take Profit | 77.00 |
| Stop Loss | 81.00 |
| Key Levels | 77.00, 79.60, 82.10, 86.20 |
Current trend
The price of North American WTI Crude Oil is correcting within an uptrend, trading at 81.24.
The current trend is due to the reports of another increase in oil supplies from the Russian Federation after two months of reduction: over the past week, crude oil exports by sea increased by 880.0K barrels per day compared to an increase in the first three weeks of August by 40.0K barrels per day. Last week, the cumulative increase was 3.4M barrels per day, close to late spring levels. Experts note that even with the current supply level Russia complies with the OPEC agreements to reduce exports in August by 500.0K barrels per day.
American oil reserves continue to decline: according to the report from the American Petroleum Institute (API), last week they adjusted by –11.486M barrels compared to –2.418M barrels earlier. It is expected that the data of the Energy Information Administration of the US Department of Energy (EIA) will reflect a change in the indicator by –3.267M barrels but given the statistics from the API, this value may turn out to be much higher, which will support oil quotes.
Support and resistance
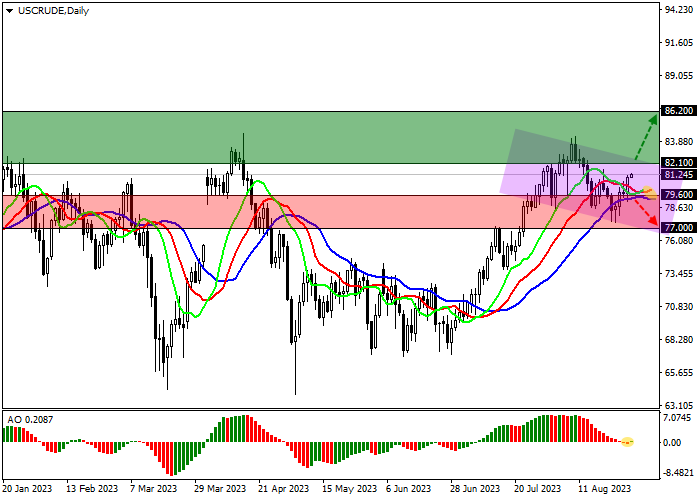
On the daily chart, the trading instrument is correcting upward, forming a local downward channel, which can work as a Flag pattern with a sales level of 82.00.
Technical indicators strengthen the buy signal: fast EMAs on the Alligator indicator expand the range of fluctuations, and the AO histogram forms ascending bars, rising in the buy zone.
Resistance levels: 82.10, 86.20.
Support levels: 79.60, 77.00.
Trading tips
Long positions may be opened after the price rises and consolidates above 82.10 with the target at 86.20. Stop loss — 80.00. Implementation period: 7 days or more.
Short positions may be opened after the price declines and consolidates below 79.60 with the target at 77.00. Stop loss — 81.00.
免責事項:本記事で述べられている見解は著者の見解のみであり、Followmeの公式見解を反映するものではありません。Followmeは、提供された情報の正確性、完全性、信頼性について一切責任を負いません。また、書面で明示的に記載されている場合を除き、本記事の内容に基づいて行われたいかなる行動についても責任を負いません。

