| Scenario | |
|---|---|
| Timeframe | Intraday |
| Recommendation | BUY STOP |
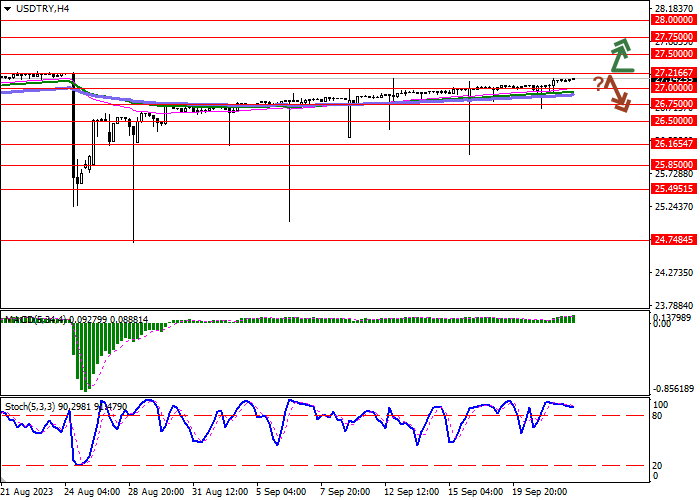
| Entry Point | 27.2170 |
| Take Profit | 27.5000 |
| Stop Loss | 27.0000 |
| Key Levels | 26.1654, 26.5000, 26.7500, 27.0000, 27.2166, 27.5000, 27.7500, 28.0000 |
| Alternative scenario | |
|---|---|
| Recommendation | SELL STOP |
| Entry Point | 27.0000 |
| Take Profit | 26.5000 |
| Stop Loss | 27.2166 |
| Key Levels | 26.1654, 26.5000, 26.7500, 27.0000, 27.2166, 27.5000, 27.7500, 28.0000 |
Current trend
During the Asian session, the USD/TRY pair shows ambiguous dynamics, holding close to 27.0000 against the economic situation in Turkey.
Yesterday, the country’s Central Bank raised the interest rate from 25.0% to 30.0%, while analysts expected a more cautious tightening of monetary policy. In an accompanying statement, the regulator notes that such a rapid increase in borrowing costs is a response to unprecedented inflation, which in August amounted to 58.9% YoY against strengthening domestic demand, as well as a correction in prices for services and oil. The agency’s governor, Hafize Gaye Ercan, said that the “hawkish” rhetoric would continue until the consumer price index reaches 5.0% in the medium term, which could be supported by demand for local currency-denominated assets, rising tourism profits, and improving conditions for investment. The decision of the Central Bank of the Republic of Turkey contrasts with the cautious positions of the US Federal Reserve, the Bank of England, and the Swiss National Bank, which kept interest rates at the same level, while experts predicted the rhetoric only from the American regulator.
On Friday, investors will focus on the September US business activity indices: analysts expect an increase in S&P Global service PMI from 50.5 points to 50.6 points, and in the manufacturing PMI from 47.9 points to 48.0 points.
Support and resistance
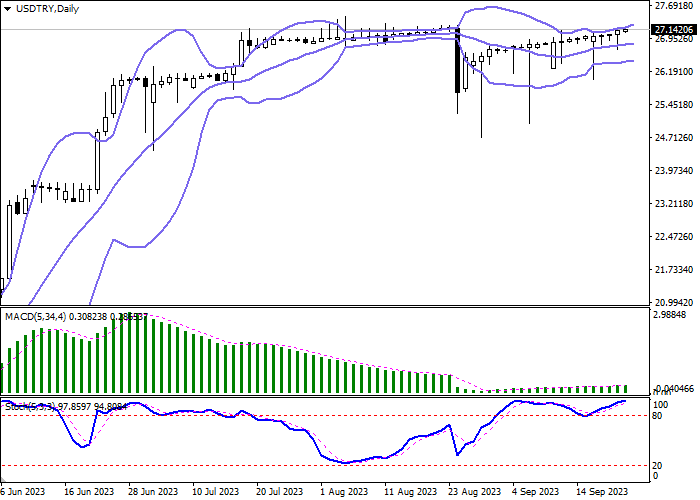
On the daily chart, Bollinger Bands are moving flat. The price range expands from above, letting the “bulls” renew local highs. The MACD indicator is growing, maintaining a poor buy signal (the histogram is above the signal line). Stochastic, having reached its highs, reversed horizontally, indicating that the US dollar may become overbought in the ultra-short term.
Resistance levels: 27.2166, 27.5000, 27.7500, 28.0000.
Support levels: 27.0000, 26.7500, 26.5000, 26.1654.

Trading tips
Long positions may be opened after the level 27.2166 is broken upward with the target at 27.5000. Stop loss – 27.0000. Implementation time: 2–3 days.
Short positions may be opened after a rebound from 27.2166 and a breakdown of 27.0000 with the target at 26.5000. Stop loss – 27.2166.
免責事項:本記事で述べられている見解は著者の見解のみであり、Followmeの公式見解を反映するものではありません。Followmeは、提供された情報の正確性、完全性、信頼性について一切責任を負いません。また、書面で明示的に記載されている場合を除き、本記事の内容に基づいて行われたいかなる行動についても責任を負いません。

古いコメントはありません。ソファをつかむ最初のものになりましょう。