· Views 97
免責事項:本記事で述べられている見解は著者の見解のみであり、Followmeの公式見解を反映するものではありません。Followmeは、提供された情報の正確性、完全性、信頼性について一切責任を負いません。また、書面で明示的に記載されている場合を除き、本記事の内容に基づいて行われたいかなる行動についても責任を負いません。
この記事が気に入ったら、著者にチップを送って感謝の気持ちを表しましょう。

| Scenario | |
|---|---|
| Timeframe | Weekly |
| Recommendation | SELL STOP |
| Entry Point | 90.00 |
| Take Profit | 86.00 |
| Stop Loss | 92.00 |
| Key Levels | 85.00, 86.00, 90.00, 91.50, 92.00, 95.00, 98.00 |
| Alternative scenario | |
|---|---|
| Recommendation | BUY STOP |
| Entry Point | 93.00 |
| Take Profit | 98.00 |
| Stop Loss | 90.00 |
| Key Levels | 85.00, 86.00, 90.00, 91.50, 92.00, 95.00, 98.00 |
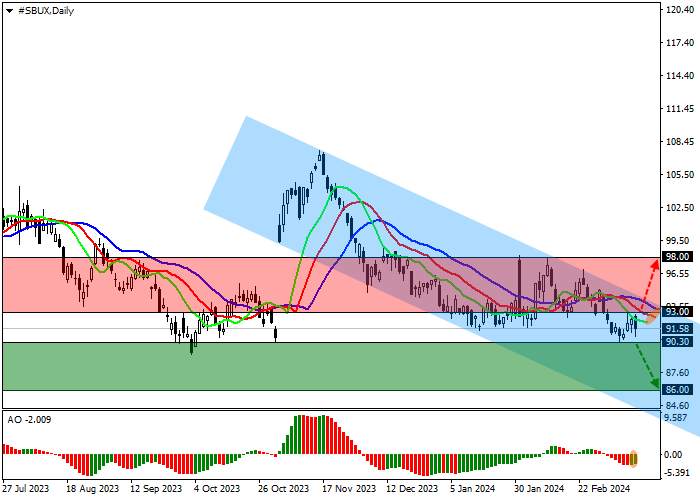
Shares of Starbucks Corp., one of the largest companies that owns the coffee shop chain of the same name, are moving in a corrective trend at 92.00.
On the daily chart, the price is holding near the resistance line of the global downward channel 95.00–85.00, trying to start a wave of decline.
On the four-hour chart, the quotes renewed the local low of 91.50, which allows it to reach the support level of 85.00. The current obstacle is last week’s low 90.00, consolidation below which will provide final confirmation for the formation of short positions.
Technical indicators have given a poor signal to sell: fast EMA on the Alligator indicator are moving away from the signal line, expanding the range of fluctuations, and the AO histogram is forming corrective bars in the sales zone.
Trading tips
Short positions may be opened after the price declines and consolidates below 90.00 with the target at 86.00. Stop loss – 92.00. Implementation period: 7 days or more.
Long positions may be opened after the price rises and consolidates above 93.00 with the target at 98.00. Stop loss – 90.00.
免責事項:本記事で述べられている見解は著者の見解のみであり、Followmeの公式見解を反映するものではありません。Followmeは、提供された情報の正確性、完全性、信頼性について一切責任を負いません。また、書面で明示的に記載されている場合を除き、本記事の内容に基づいて行われたいかなる行動についても責任を負いません。

古いコメントはありません。ソファをつかむ最初のものになりましょう。