· Views 57
免責事項:本記事で述べられている見解は著者の見解のみであり、Followmeの公式見解を反映するものではありません。Followmeは、提供された情報の正確性、完全性、信頼性について一切責任を負いません。また、書面で明示的に記載されている場合を除き、本記事の内容に基づいて行われたいかなる行動についても責任を負いません。
この記事が気に入ったら、著者にチップを送って感謝の気持ちを表しましょう。

| Scenario | |
|---|---|
| Timeframe | Weekly |
| Recommendation | BUY STOP |
| Entry Point | 104.60 |
| Take Profit | 108.30 |
| Stop Loss | 103.00 |
| Key Levels | 86.00, 98.60, 102.00, 103.00, 104.60, 108.00, 108.70 |
| Alternative scenario | |
|---|---|
| Recommendation | SELL STOP |
| Entry Point | 102.00 |
| Take Profit | 98.60 |
| Stop Loss | 103.00 |
| Key Levels | 86.00, 98.60, 102.00, 103.00, 104.60, 108.00, 108.70 |
Shares of 3M Co., an American diversified innovation and manufacturing company, are trading at 103.00.
On the daily chart, the price is correcting within the global sideways channel 108.00–86.00.
On the four-hour chart, growth may continue, and the key resistance level is yesterday’s high of 104.60, after consolidating above which the quotes may reach the early January extreme of 108.70. Otherwise, a return to completion of the local price gap of 98.60–94.00 is expected.
Technical indicators are holding a buy signal: fast EMA on the Alligator indicator are significantly above the signal line, and the AO histogram is forming corrective bars in the buy zone.
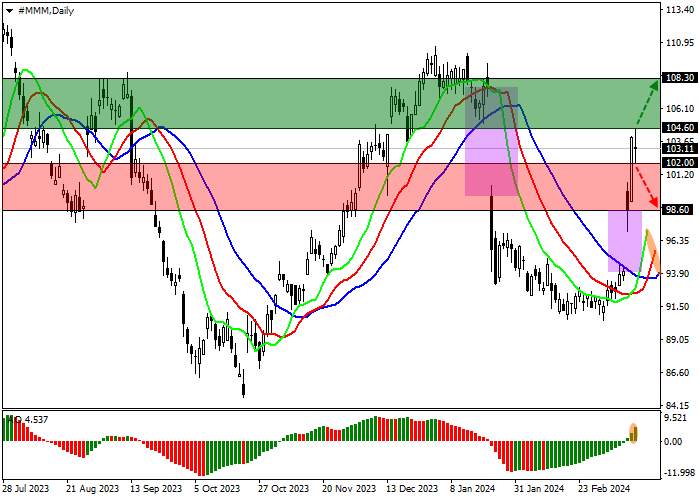
Trading tips
Long positions may be opened after the price rises and consolidates above 104.60, with the target at 108.30. Stop loss – 103.00. Implementation period: 7 days or more.
Short positions may be opened after the price declines and consolidates below 102.00, with the target at 98.60. Stop loss – 103.00.
免責事項:本記事で述べられている見解は著者の見解のみであり、Followmeの公式見解を反映するものではありません。Followmeは、提供された情報の正確性、完全性、信頼性について一切責任を負いません。また、書面で明示的に記載されている場合を除き、本記事の内容に基づいて行われたいかなる行動についても責任を負いません。

古いコメントはありません。ソファをつかむ最初のものになりましょう。