
| Scenario | |
|---|---|
| Timeframe | Weekly |
| Recommendation | BUY STOP |
| Entry Point | 289.05 |
| Take Profit | 300.00 |
| Stop Loss | 284.00 |
| Key Levels | 274.00, 283.00, 289.00, 300.00 |
| Alternative scenario | |
|---|---|
| Recommendation | SELL STOP |
| Entry Point | 282.95 |
| Take Profit | 274.00 |
| Stop Loss | 290.00 |
| Key Levels | 274.00, 283.00, 289.00, 300.00 |
Current trend
Shares of Visa Inc., the largest American multinational company providing payment transaction services, are in a corrective trend at 287.25.
Yesterday, it became known about the conclusion of a partnership agreement with the management of the international money transfer system The Western Union Co., which includes the issue of co-branded cards combining services from both companies. They will also integrate the Visa Direct solution, which will allow one to instantly transfer funds outside the United States.
Visa Inc. will publish its financial report on April 23: analysts expect revenue to reach 8.62 billion dollars, slightly above 8.6 billion dollars a quarter earlier, and earnings per share (EPS) will increase to 2.44 dollars from 2.41 dollars in the previous period.
On March 1, management paid holders of securities increased dividends from 0.45 dollars to 0.52 dollars, however, the rate of return remains not very attractive, not exceeding 0.80% per quarter.
Support and resistance
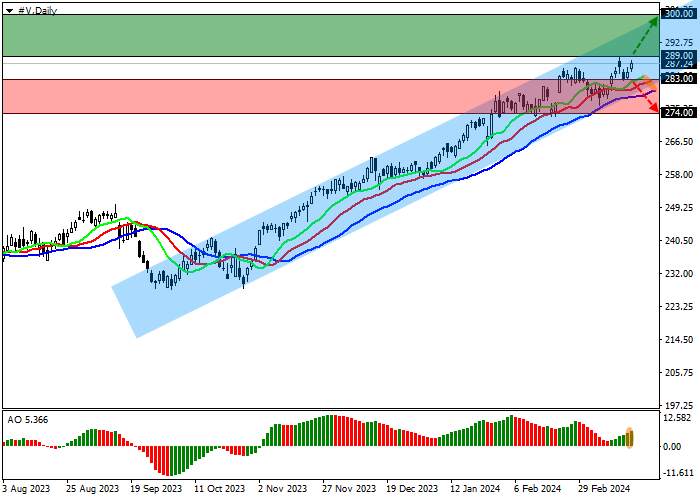
On the D1 chart, the emitter's quotes are held within the ascending channel with the borders of 300.00–280.00, preparing to reach the resistance line of 300.00.
The global buy signal from technical indicators remains stable: the range of EMAs fluctuations on the Alligator indicator is directed upwards, and fast EMAs are above the signal line, while AO histogram, trading in a positive zone, forms new correction bars.
Support levels: 283.00, 274.00.
Resistance levels: 289.00, 300.00.
Trading tips
If the asset continues to grow and the price consolidates above the resistance level of 289.00, one may open long positions with the target of 300.00 and stop-loss of 284.00. Implementation time: 7 days and more.
In case of a reversal and the beginning of a decline in the asset, as well as price consolidation below the support level of 283.00, one can open short positions with the target of 274.00 and stop-loss of 290.00.
免責事項:本記事で述べられている見解は著者の見解のみであり、Followmeの公式見解を反映するものではありません。Followmeは、提供された情報の正確性、完全性、信頼性について一切責任を負いません。また、書面で明示的に記載されている場合を除き、本記事の内容に基づいて行われたいかなる行動についても責任を負いません。

古いコメントはありません。ソファをつかむ最初のものになりましょう。