
| Scenario | |
|---|---|
| Timeframe | Intraday |
| Recommendation | SELL STOP |
| Entry Point | 151.00 |
| Take Profit | 150.00 |
| Stop Loss | 151.50 |
| Key Levels | 149.50, 150.00, 150.50, 151.00, 151.50, 152.00, 152.50, 153.00 |
| Alternative scenario | |
|---|---|
| Recommendation | BUY STOP |
| Entry Point | 151.50 |
| Take Profit | 152.50 |
| Stop Loss | 151.00 |
| Key Levels | 149.50, 150.00, 150.50, 151.00, 151.50, 152.00, 152.50, 153.00 |
Current trend
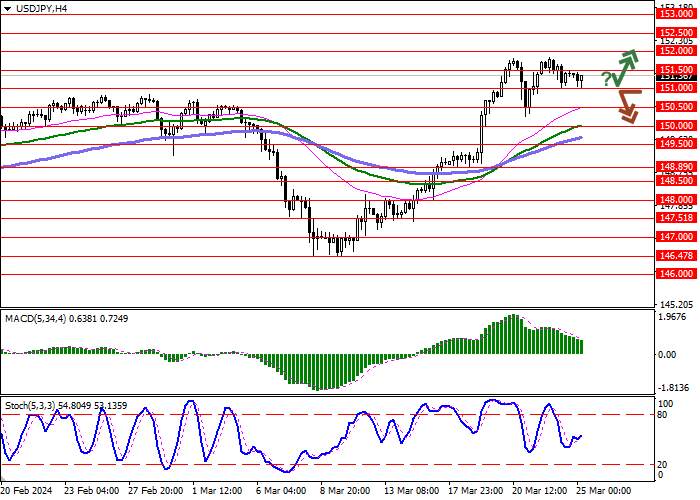
The USD/JPY pair shows mixed dynamics, holding near 151.30. Quotes are consolidating around the local highs of November 2023, updated at the end of last week, when the US currency received support from weakening expectations regarding a possible reduction in the cost of borrowing by the US Federal Reserve in the near future. Investors also paid attention to the growth of Manufacturing PMI from S&P Global from 52.2 points to 52.5 points, while analysts expected 51.7 points.
The yen, in turn, remained under pressure after the Bank of Japan's historic decision to abandon its negative interest rate policy. At the same time, the Bank’s rhetoric remained rather soft, and the markets do not expect the trend toward an increase in the rate to develop in the near future. In turn, statistics could not act as a driver for strengthening the position of the national currency: the Consumer Price Index in February rose from 2.2% to 2.8%, and the CPI excluding Food and Energy decreased from 3.5% to 3.2%. In this regard, it is worth noting the results of a survey of leading economists on the subject of further actions of the Japanese regulator, published by Reuters: more than half of respondents expect that during the year officials will increase borrowing costs by 25 basis points at least once more.
On Friday, March 29, consumer inflation data in the Tokyo region for March will be published, as well as February statistics on retail sales and industrial production. Forecasts suggest an increase in Retail Sales from 2.3% to 3.0%.
Support and resistance
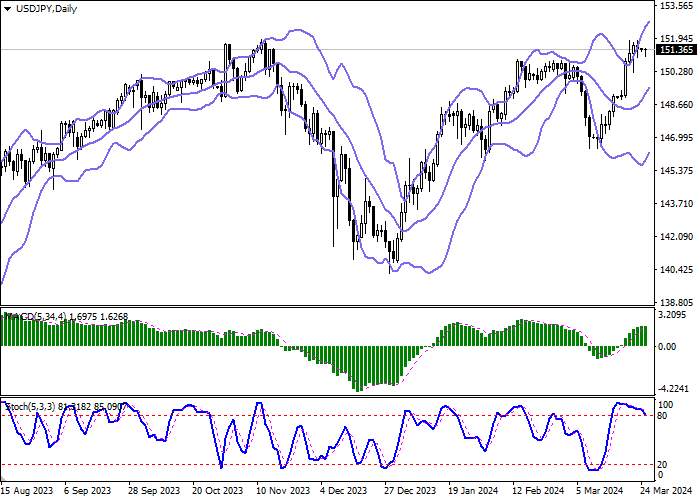
Bollinger Bands on the daily chart show a steady increase. The price range expands, freeing a path to new local highs for the "bulls". MACD is demonstrating an attempt to reverse into a downward plane; however, it still retains its previous buy signal (the histogram is located above the signal line). Stochastic shows a more confident decline, retreating from its highs, signaling the risks of the US currency being overbought in the ultra-short term.
Resistance levels: 151.50, 152.00, 152.50, 153.00.
Support levels: 151.00, 150.50, 150.00, 149.50.
Trading tips
Short positions may be opened after a breakdown of 151.00 with the target at 150.00. Stop-loss — 151.50. Implementation time: 2-3 days.
A rebound from 151.00 as from support followed by a breakout of 151.50 may become a signal for opening new long positions with the target at 152.50. Stop-loss — 151.00.
免責事項:本記事で述べられている見解は著者の見解のみであり、Followmeの公式見解を反映するものではありません。Followmeは、提供された情報の正確性、完全性、信頼性について一切責任を負いません。また、書面で明示的に記載されている場合を除き、本記事の内容に基づいて行われたいかなる行動についても責任を負いません。

古いコメントはありません。ソファをつかむ最初のものになりましょう。