


| Scenario | |
|---|---|
| Timeframe | Intraday |
| Recommendation | BUY STOP |
| Entry Point | 7977.0 |
| Take Profit | 8030.0 |
| Stop Loss | 7940.0 |
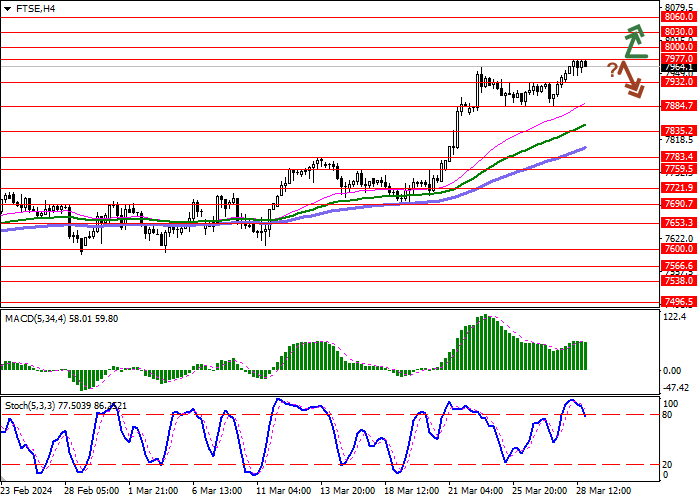
| Key Levels | 7783.4, 7835.2, 7884.7, 7932.0, 7977.0, 8000.0, 8030.0, 8060.0 |
| Alternative scenario | |
|---|---|
| Recommendation | SELL STOP |
| Entry Point | 7932.0 |
| Take Profit | 7835.2 |
| Stop Loss | 7977.0 |
| Key Levels | 7783.4, 7835.2, 7884.7, 7932.0, 7977.0, 8000.0, 8030.0, 8060.0 |
Current trend
The British FTSE 100 stock index is showing strong growth at the end of the week, renewing record highs set in March 2023 and testing 7977.0 for a breakout. Investors are taking advantage of a rather thin market formed at the end of the week against the backdrop of the celebration of Easter. At the same time, some traders are in no hurry to open new positions ahead of the publication of macroeconomic statistics on inflation in the United States.
In turn, data published yesterday on Gross Domestic Product (GDP) in the UK in the fourth quarter of 2023 reflected a contraction of the national economy by 0.3% on a quarterly basis and 0.2% on an annual basis. At the same time, the country's balance of payments deficit increased from -18.52 billion pounds to -21.18 billion pounds, while analysts expected -21.4 billion pounds. Meanwhile, Total Business Investment fell from 1.5% to 1.4% in quarterly terms and from 3.7% to 2.8% in annual terms.
Stock indices continue to be supported by expectations that key interest rates from global central banks will soon be cut. Inflation in the eurozone and the UK is slowing down quite quickly, but the British economy has recorded a technical recession for the first time since the COVID-19 pandemic.
Support and resistance
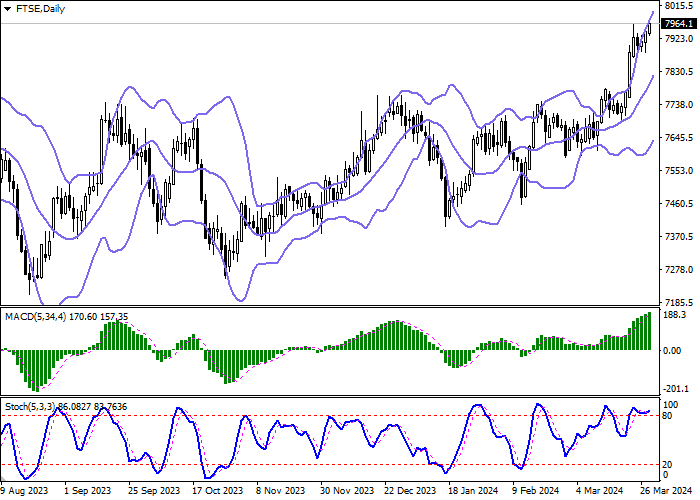
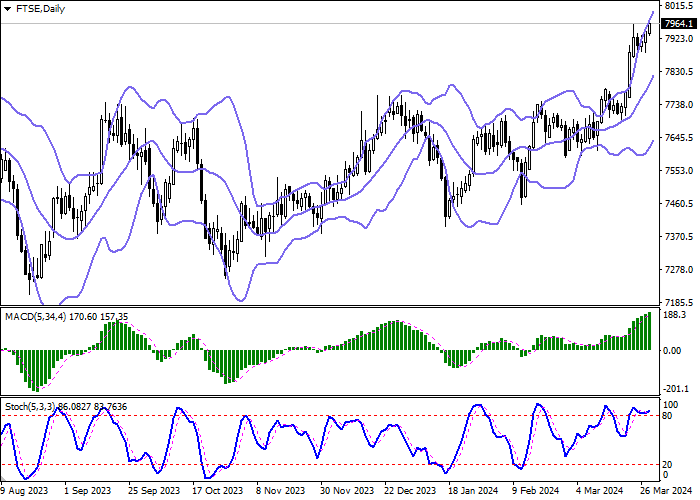
Bollinger Bands on the daily chart show a steady increase. The price range expands from above, freeing a path to new local highs for the "bulls". MACD grows, preserving a stable buy signal (located above the signal line). Stochastic has been near its highs for some time, signaling the risks of the index being overbought in the ultra-short term.
Resistance levels: 7977.0, 8000.0, 8030.0, 8060.0.
Support levels: 7932.0, 7884.7, 7835.2, 7783.4.
Trading tips
Long positions can be opened after a breakout of 7977.0 with the target of 8030.0. Stop-loss — 7940.0. Implementation time: 1-2 days.
A rebound from 7977.0 as from resistance, followed by a breakdown of 7932.0 may become a signal for opening of new short positions with the target at 7835.2. Stop-loss — 7977.0.
免責事項:本記事で述べられている見解は著者の見解のみであり、Followmeの公式見解を反映するものではありません。Followmeは、提供された情報の正確性、完全性、信頼性について一切責任を負いません。また、書面で明示的に記載されている場合を除き、本記事の内容に基づいて行われたいかなる行動についても責任を負いません。

