


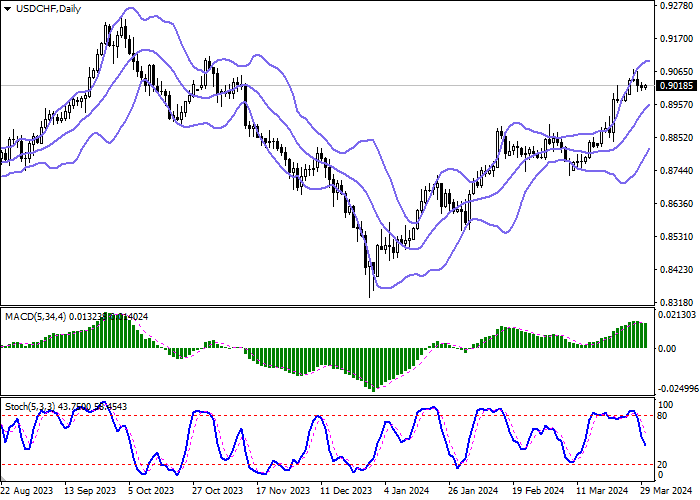
| Scenario | |
|---|---|
| Timeframe | Intraday |
| Recommendation | SELL STOP |
| Entry Point | 0.9000 |
| Take Profit | 0.8935 |
| Stop Loss | 0.9037 |
| Key Levels | 0.8900, 0.8935, 0.8964, 0.9000, 0.9037, 0.9071, 0.9100, 0.9130 |
| Alternative scenario | |
|---|---|
| Recommendation | BUY STOP |
| Entry Point | 0.9040 |
| Take Profit | 0.9100 |
| Stop Loss | 0.9000 |
| Key Levels | 0.8900, 0.8935, 0.8964, 0.9000, 0.9037, 0.9071, 0.9100, 0.9130 |
Current trend
During the Asian session, the USD/CHF pair is growing slightly, testing 0.9020: activity in the market remains subdued, as European markets are closed on Monday due to the celebration of Catholic Easter.
At 16:00 (GMT 2), investors expect the publication of the manufacturing PMI: forecasts suggest that the index from the Institute of Supply Management (ISM) in March will increase from 47.8 points to 48.4 points and from S&P Global – will remain at 52.5 points. In February, the core indicator of personal consumption expenditures decreased from 0.5% to 0.3% MoM and from 2.9% to 2.8% YoY, justifying preliminary estimates. Thus, the slowdown in inflationary pressure continues at a steady pace, convincing investors that the US Federal Reserve will keep interest rates the same in May and begin lowering them in June.
On Thursday, market participants will pay attention to Swiss data on consumer inflation dynamics in March: forecasts suggest an adjustment in the dynamics from 0.6% to 0.3% MoM and from 1.2% to 1.4% YoY. Traders saw the Swiss National Bank’s (SNB) interest rate cut last month as a false start in monetary easing, and many experts believe that actual inflation statistics could make a significant adjustment to financial authorities’ rhetoric.
World analysts expect a gradual weakening of the Swiss franc this year: thus, economists at Bank of America Corp. assumed that, against the euro, the franc may reach parity (the 1.00 mark) by September.
Support and resistance
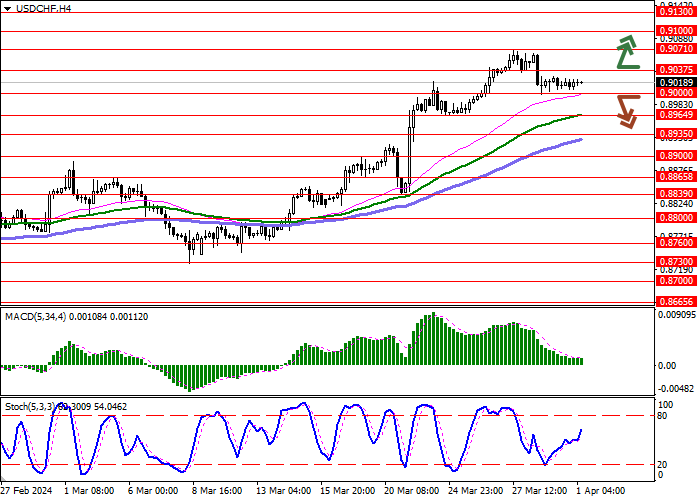
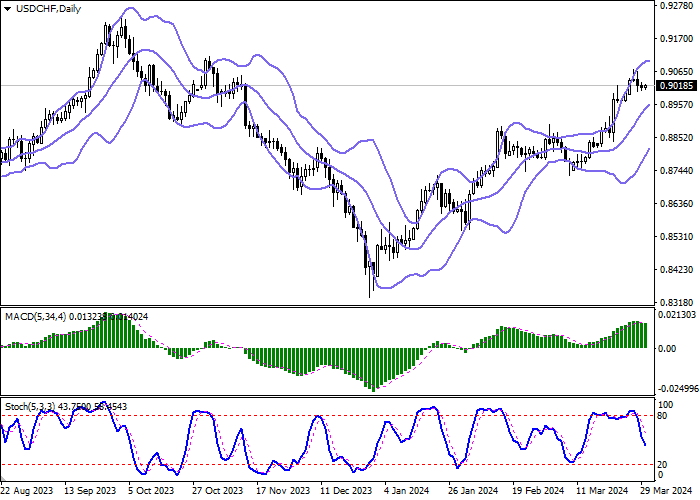
On the daily chart, Bollinger Bands are growing moderately: the price range is narrowing from above, remaining quite spacious for the current level of activity in the market. The MACD indicator is trying to reverse downwards and form a new sell signal (the histogram tends to be located below the signal line). Stochastic shows similar dynamics, located below the middle of the working area, which indicates sufficient potential for the development of a downward trend soon.
Resistance levels: 0.9037, 0.9071, 0.9100, 0.9130.
Support levels: 0.9000, 0.8964, 0.8935, 0.8900.
Trading tips
Short positions may be opened after a breakdown of 0.9000 with the target at 0.8935. Stop loss – 0.9037. Implementation time: 2–3 days.
Long positions may be opened after a breakout of 0.9037 with the target at 0.9100. Stop loss – 0.9000.
01 Apr 2024, 18:38 を編集しました
免責事項:本記事で述べられている見解は著者の見解のみであり、Followmeの公式見解を反映するものではありません。Followmeは、提供された情報の正確性、完全性、信頼性について一切責任を負いません。また、書面で明示的に記載されている場合を除き、本記事の内容に基づいて行われたいかなる行動についても責任を負いません。

