


· Views 132
免責事項:本記事で述べられている見解は著者の見解のみであり、Followmeの公式見解を反映するものではありません。Followmeは、提供された情報の正確性、完全性、信頼性について一切責任を負いません。また、書面で明示的に記載されている場合を除き、本記事の内容に基づいて行われたいかなる行動についても責任を負いません。
この記事が気に入ったら、著者にチップを送って感謝の気持ちを表しましょう。
| Scenario | |
|---|---|
| Timeframe | Weekly |
| Recommendation | BUY STOP |
| Entry Point | 58.50 |
| Take Profit | 63.00 |
| Stop Loss | 57.00 |
| Key Levels | 52.30, 54.00, 56.30, 57.00, 58.00, 58.20, 62.00, 63.00 |
| Alternative scenario | |
|---|---|
| Recommendation | SELL STOP |
| Entry Point | 56.50 |
| Take Profit | 52.30 |
| Stop Loss | 58.00 |
| Key Levels | 52.30, 54.00, 56.30, 57.00, 58.00, 58.20, 62.00, 63.00 |
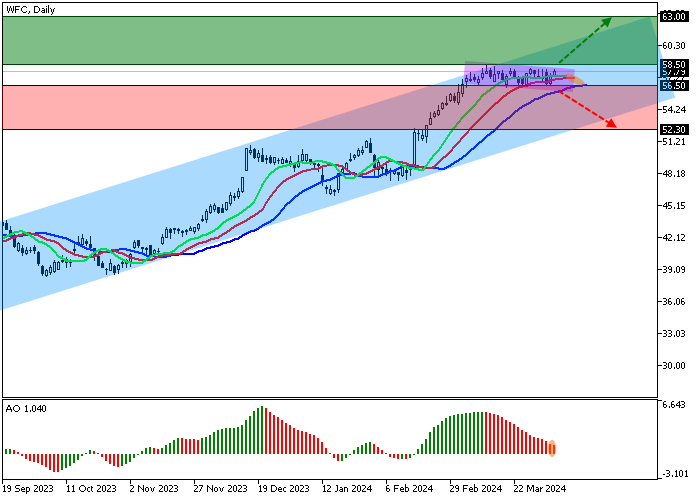
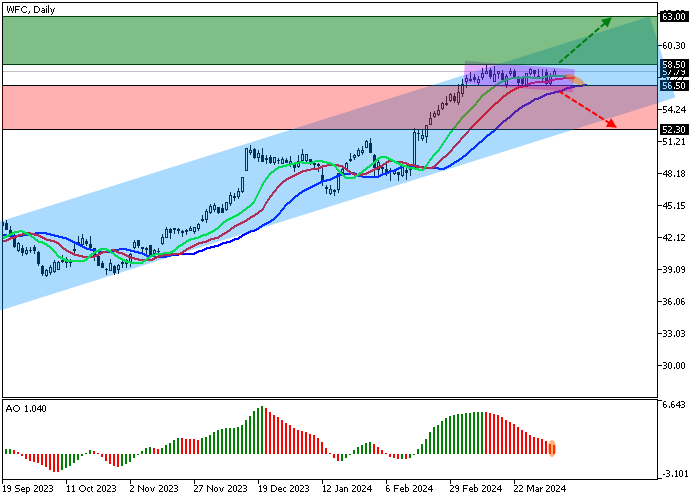
Shares of Wells Fargo & Co., one of the leading banking and insurance companies in the United States, are trading at 58.00.
On the daily chart, the price is moving in a corrective trend, staying within the ascending corridor of 62.00–54.00.
On the four-hour chart, after reaching the channel resistance line of 58.00, the quotes began to form a corrective downward channel with dynamic boundaries of 58.20–56.30, which can work as a Flag trend continuation pattern, and the upward dynamics will reach 63.00.
Technical indicators are slowing down the buy signal against a correction: fast EMAs of the Alligator indicator are above the signal line, narrowing the range of fluctuations, and the AO histogram forms corrective bars above the transition level.
Trading tips
Long positions may be opened after the price rises and consolidates above 58.50, with the target at 63.00. Stop loss – 57.00. Implementation period: 7 days or more.
Short positions may be opened after the price declines and consolidates below 56.50, with the target at 52.30. Stop loss – 58.00.
免責事項:本記事で述べられている見解は著者の見解のみであり、Followmeの公式見解を反映するものではありません。Followmeは、提供された情報の正確性、完全性、信頼性について一切責任を負いません。また、書面で明示的に記載されている場合を除き、本記事の内容に基づいて行われたいかなる行動についても責任を負いません。

