


| Scenario | |
|---|---|
| Timeframe | Weekly |
| Recommendation | BUY STOP |
| Entry Point | 154.20 |
| Take Profit | 157.20 |
| Stop Loss | 152.00 |
| Key Levels | 148.90, 153.10, 154.20, 157.00 |
| Alternative scenario | |
|---|---|
| Recommendation | SELL STOP |
| Entry Point | 153.10 |
| Take Profit | 148.90 |
| Stop Loss | 154.00 |
| Key Levels | 148.90, 153.10, 154.20, 157.00 |
Current trend
During the Asian session, the USD/JPY pair builds on last week’s “bullish” momentum, testing the level of 153.85 supported by expectations of the US Fed interest rate postponing from June to a later date.
The quotes exceeded the historical mark of 151.90, but their further growth seems limited due to the Bank of Japan’s intentions to influence the market situation. Note that the yen did not significantly strengthen after the regulator abandoned the policy of negative interest rates last month, and agency representatives believe it happened due to speculative activity. Given the poor macroeconomic statistics, the yen may decline further. The February industrial production amounted to –0.6%, worse than forecast at –0.1%. However, core orders in mechanical engineering increased from –1.7% to 7.7% MoM and from –10.9% to –1.8% YoY. There is a lack of new data that could support the yen.
The American dollar is trading at 105.70 in USDX for the first time since early November. After positive labor market statistics supported the currency, foreign trade levels disappointed investors. The March export price index rose by 0.3%, and the import price index by 0.4 %, which is generally consistent with February data, and the April University of Michigan consumer confidence index fell from 79.4 points to 77.9 points, while analysts expected 79.0 points. Today, retail sales data will be published. In case of an implementation of the positive expectations, the dollar will strengthen further.
Support and resistance
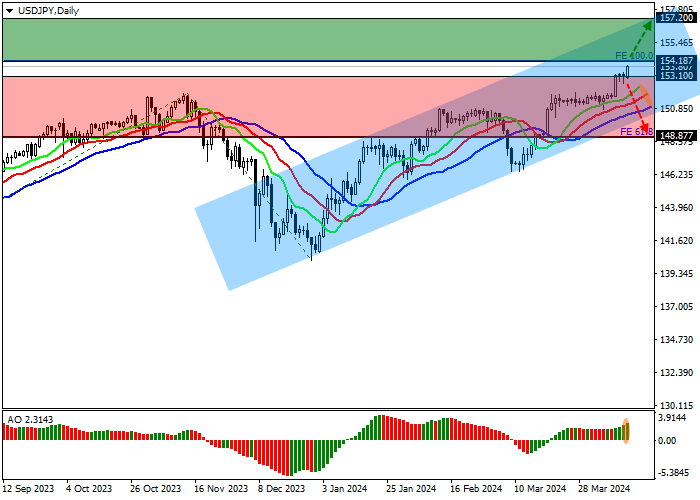
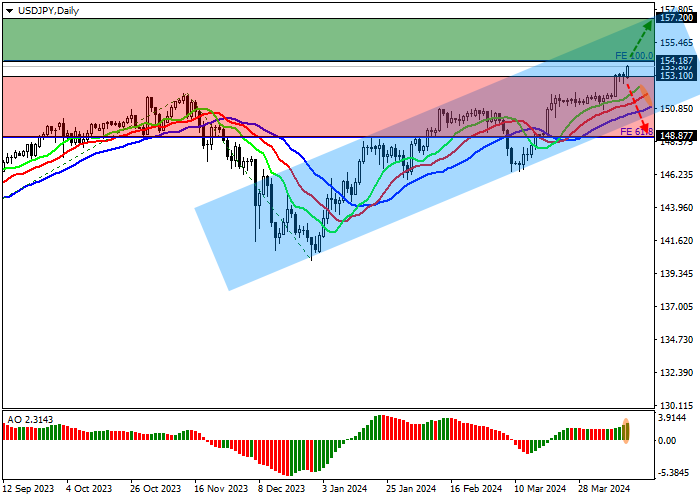
On the daily chart, the trading instrument moves within the ascending corridor of 157.00–150.00, strengthening the positive momentum after breaking the historical high of 151.90.
Technical indicators keep the buy signal: fast EMA on the Alligator indicator are above the signal line, and the AO histogram forms ascending bars in the buy zone.
Resistance levels: 154.20, 157.00.
Support levels: 153.10, 148.90.
Trading tips
Long positions may be opened after the price rises and consolidates above 154.20, with the target at 157.20. Stop loss – 152.00. Implementation period: 7 days or more.
Short positions may be opened after the price declines and consolidates below 153.10, with the target at 148.90. Stop loss – 154.00.
免責事項:本記事で述べられている見解は著者の見解のみであり、Followmeの公式見解を反映するものではありません。Followmeは、提供された情報の正確性、完全性、信頼性について一切責任を負いません。また、書面で明示的に記載されている場合を除き、本記事の内容に基づいて行われたいかなる行動についても責任を負いません。

