


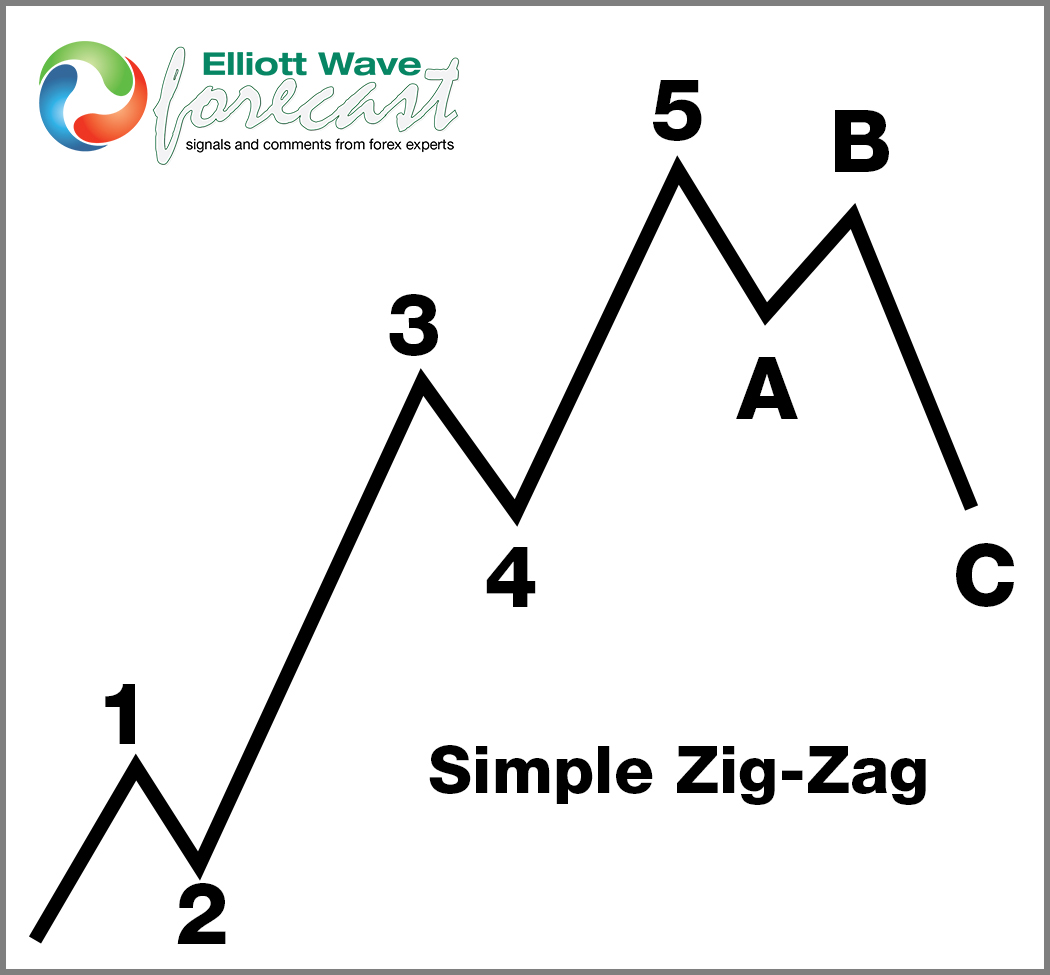
Hello everyone. In today’s article, we will look at the past performance of the 1H Hour Elliott Wave chart of SPDR Metals & Mining ETF ($XME). The rally from 3.14.2024 low at $55.37 unfolded as 5 waves impulse. So, we expected the pullback to unfold in 3 swings and find buyers again. We will explain the structure & forecast below:
5 Wave Impulse Structure + ABC correction
$XME 1H Elliott Wave Chart 4.15.2024:
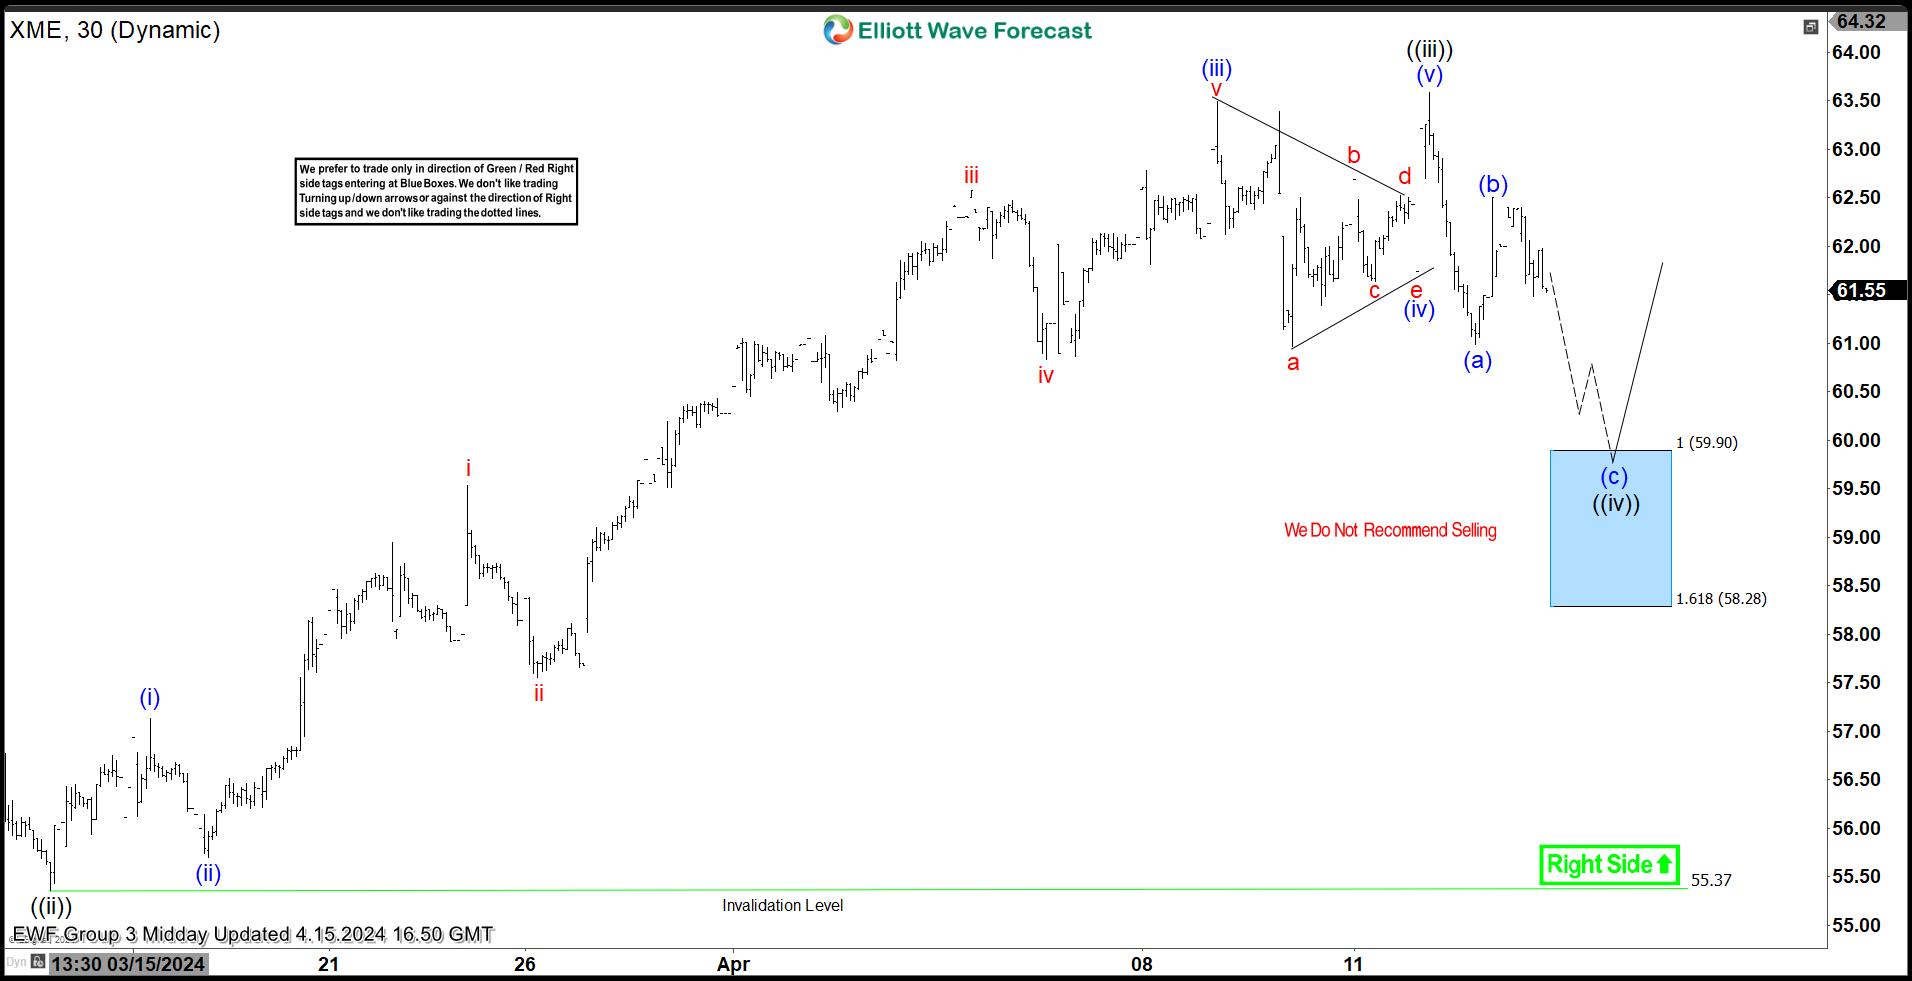 Here is the 1H Elliott Wave count from 4.15.2024. We expected the pullback to find buyers at the blue box area at 59.90 – 58.28 in 3 swings.
$XME 1H Elliott Wave Chart 4.17.2024:
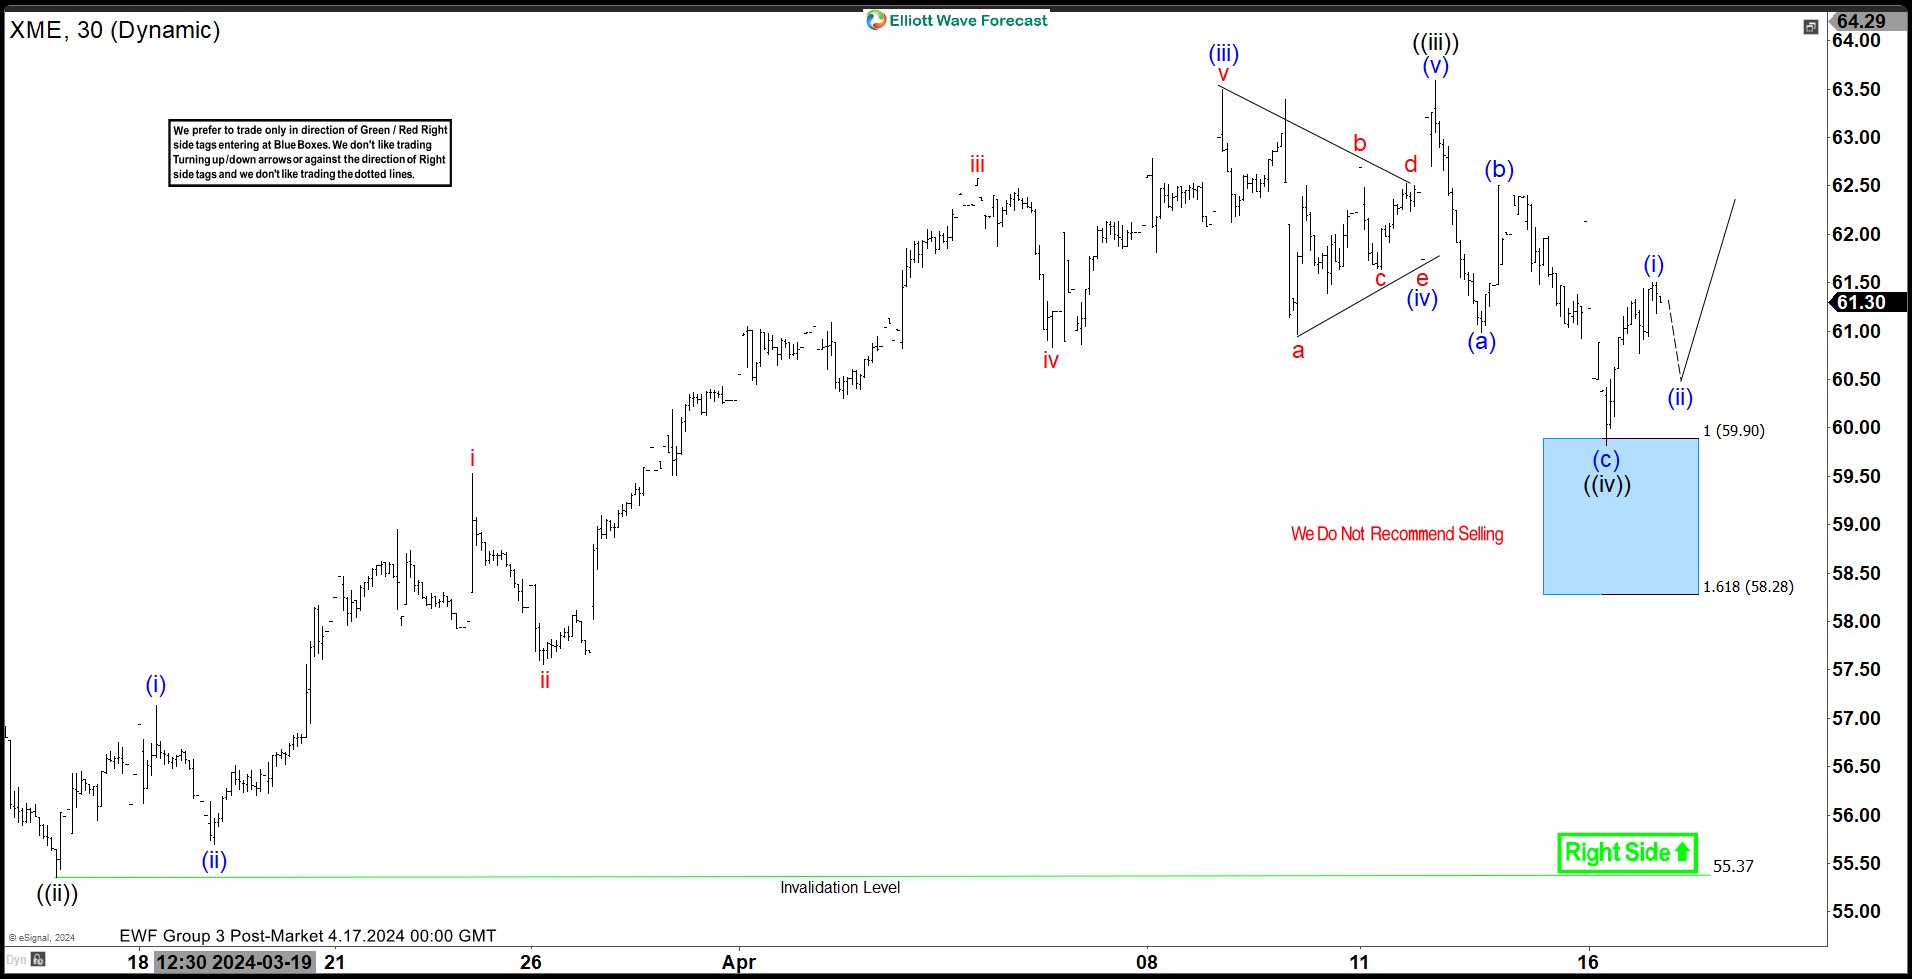 Here is the 1H update from 4.17.2024 showing the bounce taking place as expected. The ETF has reacted higher from the blue box area allowing longs to get risk free before the next leg takes place.
免責事項:本記事で述べられている見解は著者の見解のみであり、Followmeの公式見解を反映するものではありません。Followmeは、提供された情報の正確性、完全性、信頼性について一切責任を負いません。また、書面で明示的に記載されている場合を除き、本記事の内容に基づいて行われたいかなる行動についても責任を負いません。

