


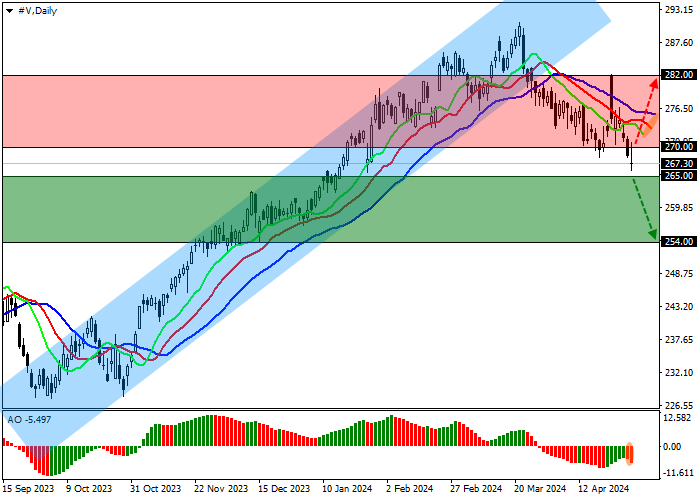
| Scenario | |
|---|---|
| Timeframe | Weekly |
| Recommendation | SELL STOP |
| Entry Point | 265.00 |
| Take Profit | 254.00 |
| Stop Loss | 271.00 |
| Key Levels | 282.00, 270.00, 265.00, 254.00 |
| Alternative scenario | |
|---|---|
| Recommendation | BUY STOP |
| Entry Point | 270.00 |
| Take Profit | 282.00 |
| Stop Loss | 265.00 |
| Key Levels | 282.00, 270.00, 265.00, 254.00 |
Current trend
Shares of Visa Inc., the largest American multinational company providing payment transaction services, are adjusting at 267.00.
The emitter's financial report, published on April 23, reflected revenue of 8.78 billion dollars, which exceeded both preliminary estimates of 8.62 billion dollars and 8.0 billion dollars over the same period a year earlier. Earnings per share (EPS) amounted to 2.51 dollars, surpassing the projected 2.44 dollars and last year's figure of 2.09 dollars. Against the background of the publication of these data, leading analysts have changed their recommendations on the company's shares. RBC Capital noted the stability of the company's business model and increased the target price from 309.0 dollars to 315.0 dollars, while maintaining the recommendation at the "Outperform" level, and Citi Bank experts maintained the rating at the "buy" level and increased the target price from 314.0 dollars to 321.0 dollars, noting the stability of Visa Inc.'s revenue growth.
The payment of the next dividend of 0.52 dollars per share is scheduled for June 6. The closing of the register will take place on May 16, and the estimated quarterly yield will be 0.77%.
Support and resistance
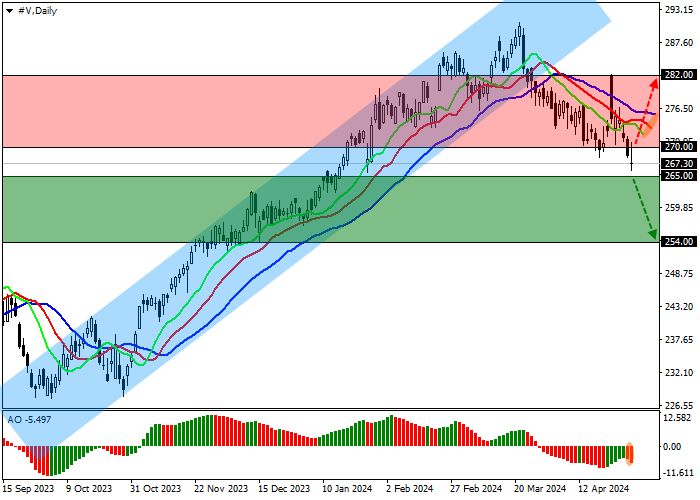
On the D1 chart, the asset is held within the correction channel with the borders of 265.00–280.00, preparing for a continuation of the decline.
The global sell signal from technical indicators remains stable: the range of EMAs fluctuations on the Alligator indicator is still pointing down, and fast EMAs are below the signal line, while AO histogram, trading in the negative zone, is forming new correction bars.
Support levels: 265.00, 254.00.
Resistance levels: 270.00, 282.00.
Trading tips
In the event of a reversal and the beginning of a decline in the asset and the price consolidation below the support level of 265.00, one can open short positions with the target of 254.00 and stop-loss of 271.00. Implementation time: 7 days and more.
If the asset continues to grow and the price consolidates above the resistance level of 270.00, one may open long positions with the target of 282.00 and stop-loss of 265.00.
免責事項:本記事で述べられている見解は著者の見解のみであり、Followmeの公式見解を反映するものではありません。Followmeは、提供された情報の正確性、完全性、信頼性について一切責任を負いません。また、書面で明示的に記載されている場合を除き、本記事の内容に基づいて行われたいかなる行動についても責任を負いません。

