


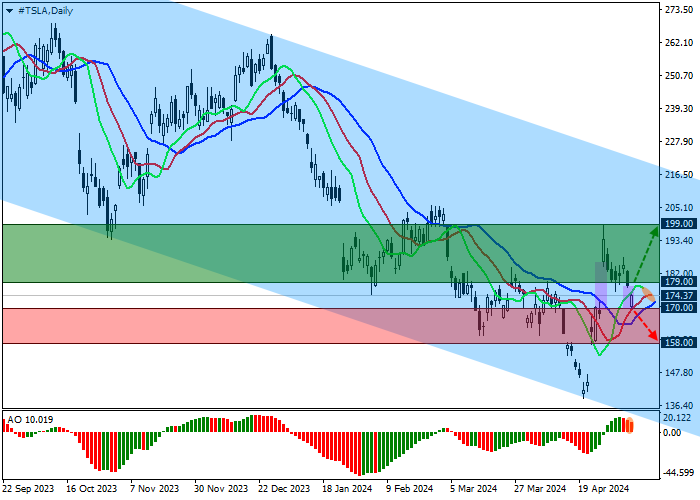
| Scenario | |
|---|---|
| Timeframe | Weekly |
| Recommendation | BUY STOP |
| Entry Point | 179.00 |
| Take Profit | 199.00 |
| Stop Loss | 170.00 |
| Key Levels | 130.00, 142.00, 169.00, 174.00, 177.00, 186.00, 200.00, 220.00 |
| Alternative scenario | |
|---|---|
| Recommendation | SELL STOP |
| Entry Point | 170.00 |
| Take Profit | 158.00 |
| Stop Loss | 176.00 |
| Key Levels | 130.00, 142.00, 169.00, 174.00, 177.00, 186.00, 200.00, 220.00 |
Shares of Tesla Inc., a leading manufacturer of electric cars, are correcting around 174.00.
On the daily chart, the price is held within the channel 220.00–130.00, trying to form a new wave of growth.
On a four-hour chart, quotes indicated a reversal near the support line at 142.00, and the appearance of two consecutive price gaps at 186.00–169.00 and 177.00–170.00 indirectly confirms the high probability of strengthening upward dynamics. In the near future, the instrument may make a new attempt to cover these gaps, which will allow it to rise to the area of the April 29 high at 200.00.
Technical indicators maintain a stable buy signal, which has slowed down somewhat amid a local correction: fast EMAs on the Alligator indicator are fixed above the signal line, and the AO histogram remains in the buy zone, forming new corrective bars.
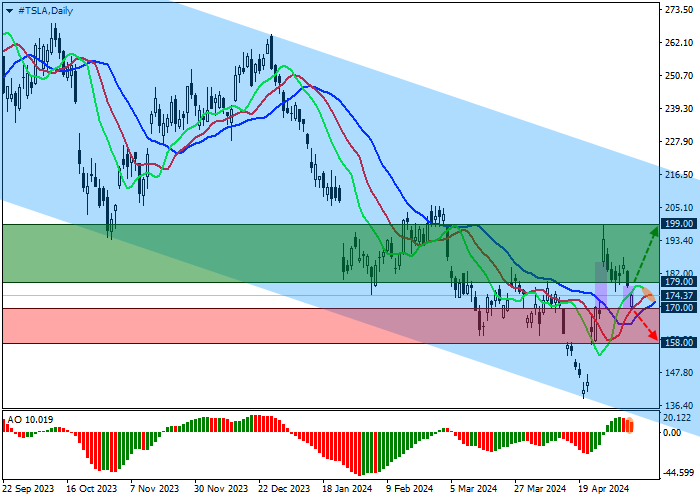
Trading tips
Long positions should be opened after the price consolidates above the resistance level of 179.00 with the target of 199.00. Stop-loss — 170.00. Implementation time: 7 days and more.
Short positions can be opened after the price consolidates below the support level of 170.00 with the target of 158.00. Stop-loss — 176.00.
免責事項:本記事で述べられている見解は著者の見解のみであり、Followmeの公式見解を反映するものではありません。Followmeは、提供された情報の正確性、完全性、信頼性について一切責任を負いません。また、書面で明示的に記載されている場合を除き、本記事の内容に基づいて行われたいかなる行動についても責任を負いません。

